Graphics Reference
In-Depth Information
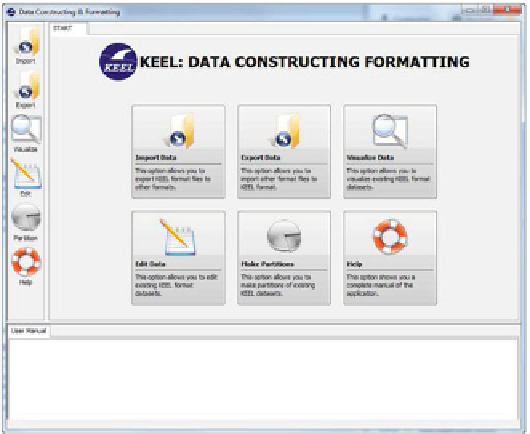
Fig. 10.1
Data management
Figure
10.1
shows an example window of the
Data Management
module in the
section of
Data Visualization
. The module has seven sections, each of which is
accessible through the buttons on the left side of the window. In the following, we
will briefly describe them:
Creation of a new data set
: This option allows us to generate a new data set
compatible with the other KEEL modules.
Import data to KEEL format
: Since KEEL works with a specific data format
(similar to the ARFF format) in all its modules, this section allows us to convert
various data formats to KEEL format, such as CSV, XML, ARFF, extracting data
from data bases, etc.
Export data from KEEL format
: This option is the reverse of the previous one.
It converts the data handled by KEEL procedures in other external formats to
establish compatibility with other software tools.
Visualization of data
: This option is used to represent and visualize the data. With
it, we can see a graphical distribution of each attribute and comparisons between
two attributes.
Edition of data
: This area is dedicated to managing the data manually. The data
set, once loaded, can be edited by modifying values, adding or removing rows and
columns, etc.
Data Partition
: This zone allows us to make the partitions of data needed by the
experiment modules to validate results. It supports
k
-FCV, 5
×
2-CV and hold-out
validation with stratified partition.