Biomedical Engineering Reference
In-Depth Information
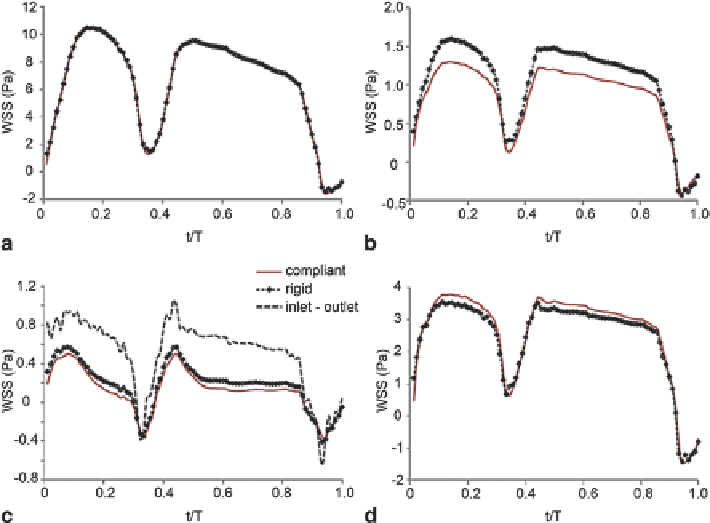
Fig. 8.64
WSS variations for one cardiac cycle at monitor points (
P
1
, P
6
, P
7
, and P
8
). The WSS
parameter that pertains to the rigid and compliant models is shown by the
red straight line
and
the
dotted dashed line
respectively. The calculated pressure waveform is shown by
dashed line
in
sub-figure
c
. (Image from Kabinejadian and Ghista 2011)
Comparison of Newtonian and non-Newtonian fluid models showed that the
TAWSS decreased at the toe, suture line, and on the bed of the anastomosis. There
was an increase at the heel for the end-to-side anastomosis that for the conventional
and sequential anastomosis models. At the side-to-side anastomosis, an increase in
TAWSS was found at all critical monitor points. This can be explained by the shear
thinning of the non-Newtonian fluid, which presents a higher shear rate at most of
the points of the end-to-side anastomosis than at the side-to-side anastomosis.
The non-Newtonian velocity profile is flattened compared to the parabolic ve-
locity profile of a Newtonian fluid shown in Fig.
8.65
. This implies that the TAWSS
is reduced at high shear rates, shown in Table
8.7
,
which is attributed to the blood
shear thinning behaviour. The velocity change becomes higher near the wall region.
8.7.3
Flow Patterns and Wall Deformation in Abdominal
Arterial Bypass Grafts
The haemodynamics before and after each bypass strategy and different types
of false lumen were compared. Velocity vectors at time t = 0.04 s during the
acceleration segment of systolic phase is shown in Fig.
8.66
. The mean velocity in
Search WWH ::

Custom Search