Biomedical Engineering Reference
In-Depth Information
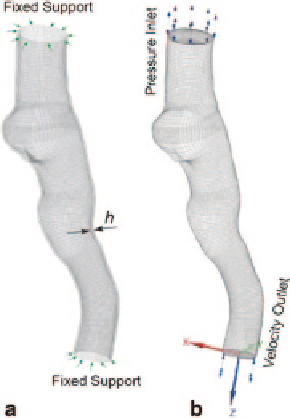
Fig. 8.54
Boundary condi-
tions setup: (
a
) fixed supports
were placed at terminals of
the structure domain, (
b
)
pressure inlet and velocity
outlets were prescribed at the
inlet and outlet of the fluid
domain
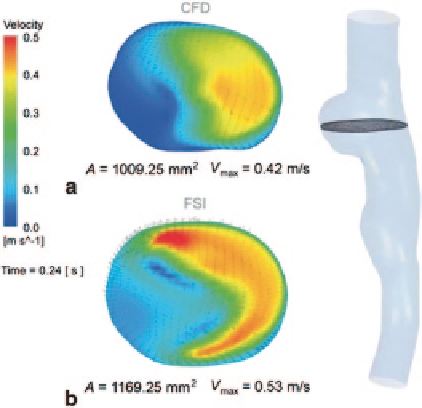
Fig. 8.55
Plane velocity
comaprison: (
a
) CFD simula-
tion using rigid wall assump-
tion, (
b
) FSI simulation using
compliant wall assumption
1009.25 mm
2
to 1169.25 mm
2
, and more blood flow with high momentum enters
the aneurysm. This is different from the velocity findings from the carotid artery
case study presented earlier in Sect. 8.3, where the CFD model under predicts the
peak velocity by 21 %. The main reason is the strengthened secondary flow in this
region, leading to an increased acceleration in the flow field.
Flow vortices characterized by its swirling strength (Fig.
8.56
) were generated
to examine the secondary flow patterns between these two approaches. The vortex
swirl inside the aneurysm is much greater for the FSI simulation compared with the
CFD simulation. Almost twice the influence region of the vortex was predicted by
Search WWH ::

Custom Search