Biomedical Engineering Reference
In-Depth Information
The maximum deformation also assumes the same trend as the two-dimensional
structural stress analysis. The larger artery in the carotid bifurcation model, pro-
duces a reduction in terms of value for critical stress. The maximum deformation
is observed to be approximately the same at
D
max
> 168 μm for the stress levels to
exceed 300 kPa.
8.5.5
Correlations Between Plaque Progression and Wall
Shear Stress
In this section we review a selection of work in the literature regarding carotid
plaque progression using FSI. It is well accepted that atherosclerosis initiation and
progression correlate positively with low and oscillating flow wall shear stresses.
Tang et al. (2008) investigated advanced plaque growth under elevated oscil-
lating flow wall shear stresses conditions. Correlations were quantified between
plaque progression measured by wall thickness increase and plaque wall (structure)
stress conditions. For the 3D FSI model, the flow was set as laminar, Newtonian,
viscous, and incompressible. The arbitrary Lagrangian-Eulerian (ALE) formulation
was used. Inlet and outlet boundaries were fixed in longitudinal (axial) direction,
but allowed to expand/contract with the flow. No-slip conditions, natural traction
equilibrium boundary conditions, and continuity of displacement were assumed on
all interfaces between all components and the interface between solid and fluid.
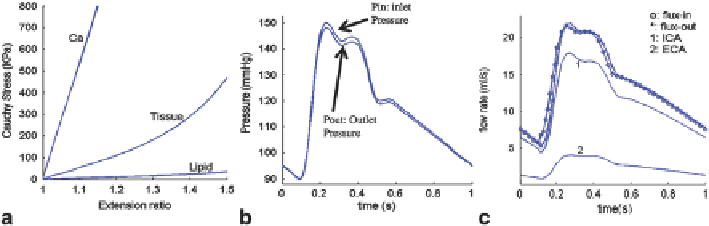
Material stress-stretch curves for fibrous tissue (vessel), lipid pool, and calcifica-
tions, prescribed inlet and outlet pressure conditions and the corresponding flow
rates obtained from the FSI model are shown in Fig.
8.42
.
Baseline results are presented in Fig.
8.43
which shows typical stress distribu-
tions (Stress-P1, which is the maximum principal stress) including the flow behav-
iors obtained from the 3D FSI plaque model. Elevated flow shear stress is observed
in the stenotic region where vessel wall is thick.
Fig. 8.42
Material curves and pressure conditions for the multi-component plaque model. (
a
)
Stress-stretch curves derived from the modified Mooney-Rivlin model. (
b
) pressure conditions
specified at the inlet (
CCA
) and outlet (
ICA and ECA
); (
c
) flow rates obtained from the 3D plaque
model solutions corresponding to the pressure conditions. (
Image from Tang et al� 2008
)
Search WWH ::

Custom Search