Biomedical Engineering Reference
In-Depth Information
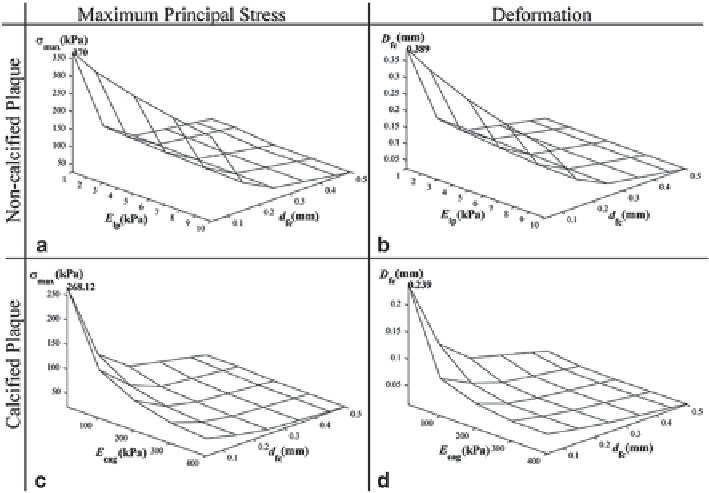
Fig. 8.38
Maximum principal stress and deformation based on elasticity of two-dimensional
plaque composite and fibrous cap thickness for non-calcified and calcified plaque. (
a
): maximum
principal stress
σ
max
versus Young's modulus
E
lp
and fibrous cap thickness
d
fc
shows that critical
stress is 370 kPa. (
b
)
σ
max
versus
E
cag
and
d
fc
shows that critical stress is 268.12 kPa. (
c
)
D
fc
versus
E
lp
and
d
fc
shows that maximum deformation
D
max
is 0.389 mm. (
d
)
D
fc
versus
E
cag
and
d
fc
gives
D
max
= 0.239 mm
In general both maximum principal stress and deformation have a negative correla-
tion with the fibrous cap thickness and Young's modulus of plaque composites. This
leads to the suggestion that the change of stress with respect to Young's modulus of
lipid core or calcification agglomerate and fibrous cap thickness tends to follow the
same variation as deformation. Calcification gap and maximum deformation thresh-
olds are established based on critical stress threshold for plaque rupture.
8.5.4.3
Two-Dimensional Fluid-Structural Analysis
The peak maximum principal stress or critical stress
σ
cr
is 370 kPa in Fig.
8.38a
cor-
responds to the highest plaque vulnerability. This is achieved where the plaque has
a lipid core with the highest elasticity and the thinnest fibrous cap. At
d
cg
= 0.02 mm,
the fibrous tissue, lipid and calcium structures are present at various concentrations
in the calcification agglomerate such that its Young's modulus
E
cag
varies from 10
to 400 kPa (Fig.
8.38b
).
Calcified plaque stress values (where
E
lp
= 1 kPa,
d
cg
= 0.02 mm and
E
cag
rang-
es from 10 to 400 kPa) demonstrate the same correlation with plaque composite
Search WWH ::

Custom Search