Biomedical Engineering Reference
In-Depth Information
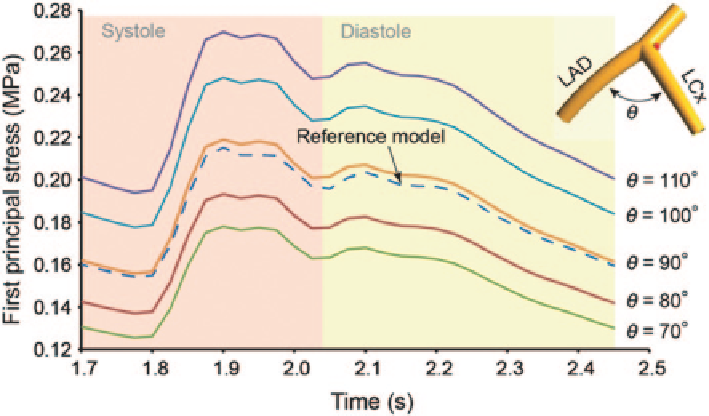
Fig. 8.26
First principal stress at the LCx side bifurcation shoulder denoted by a
red dot
on the
bifurcation
occurs at the LCx side bifurcation shoulder (
σ
max
= 0.27 MPa) rather than the bifur-
cation apex (
σ
max
= 0.24 MPa).
The image-based model also displays a similar stress variation profile with the
idealized model (
θ
= 90°) both on the bifurcation apex and the LCx side bifurcation
shoulder. Along with the results shown in Fig.
8.24
, it can be demonstrated that the
idealized models are capable of representing key FSI results for further analysis.
8.4.4
Haemodynamic Results Analysis
The WSS-based oscillatory shear index (OSI) is a flow indicator used to evaluate the
total shear stress exerted on the arterial wall (Fig.
8.27
). It can be regarded as the frac-
tion of angle and magnitude change between the instantaneous WSS and the time-
averaged WSS ranging from 0 to 0.5. High OSI indicates unsteady and oscillatory
flow with low WSS which leads to a predisposition of endothelial dysfunction and
atherogenesis (Dong et al. 2013b; Ku et al. 1985b). Generally, high OSI regions are
concentrated at the origins and proximal LCx branches with no significant differences
among idealized models. This indicates the affected regions are susceptible to prog-
ress atherosclerotic changes due to the presence of disturbed flow. As a reference, the
image-based model shows a similar OSI distribution except in the distal LAD branch,
where a locally high OSI is found caused by a moderate bulge section. Due to this
luminal expansion, local flow separation and disturbance appear as a result.
Wall shear stress predicted by FSI and rigid model are compared in Fig.
8.28a
.
The rigid model predicts a greater distribution of higher WSS values at peak diastole
Search WWH ::

Custom Search