Biomedical Engineering Reference
In-Depth Information
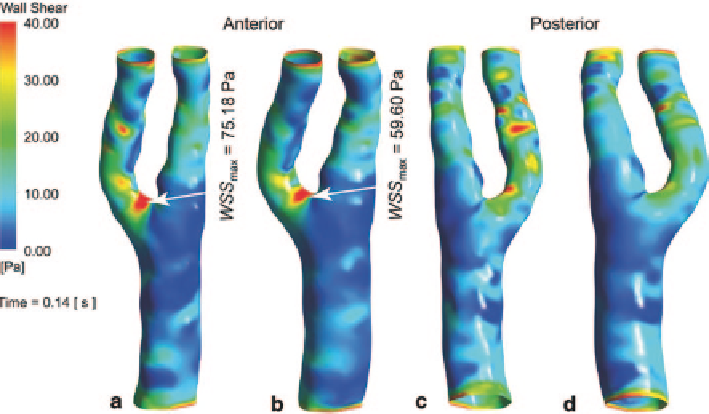
Fig. 8.18
Wall shear stress comparison at the peak systole (
a
) and (
c
) front and back views of the
WSS distribution based on CFD approach (
rigid wall
), (
b
) and (
d
) front and back views of the
WSS distritution based on the FSI approach (
compliant wall
)
Since the wall shear stress (WSS) is a widely used bio-marker for vascular dis-
ease, its results give more meaningful data than blood flow velocity for clinical
diagnosis purpose. A WSS comparison at peak systole between CFD and FSI mod-
elling methods is shown in Fig.
8.18
. From the anterior view, both modelling ap-
proaches capture the peak WSS stress location. The CFD simulation predicts the
maximum WSS value by 26 % more than the FSI approach. From the posterior
view, the prediction of high risk WSS regions (where the WSS exceeds 40 Pa)
shows more differences between these two methods. The CFD simulation shows
more regions located on the ECA branch of high risk WSS area, while the FSI
simulation does not.
8.3.3
Closure
The haemodynamics in a healthy carotid artery subject was numerically investi-
gated with a fully coupled FSI approach, and the simulation results were compared
with a rigid wall CFD approach. With the mechanical modelling of arterial vessel,
the influence of vessel deformation was taken into account, and a decrease of blood
flow velocity and wall shear stress were observed. The numerical studies shows
vessel compliance needs to be modelled using the FSI simulation approach, and the
haemodynamic characteristics of the carotid artery can be used to predict the lumen
area at risk for vascular disease diagnosis purposes.
Search WWH ::

Custom Search