Biomedical Engineering Reference
In-Depth Information
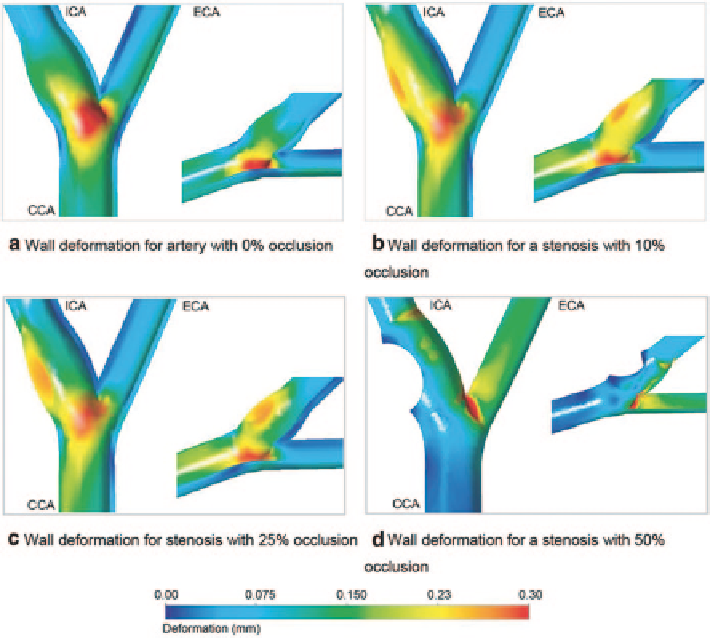
Fig. 8.7
Deformation contour plots of carotid bifurcation with different degrees of stenosis. The
simulation pertains to an atherosclerotic artery are presented for (
a
) 0 % or healthy case; (
b
) 10 %
blockage; (
c
) 25 % blockage and; (
d
) 50 % blockage. The deformation scale is in metres
with time, corresponding to the input pressure waveform (this is discussed in the
next section of this Chapter). Furthermore as the degree of stenosis increases, the
wall deformation in the stenosis region reduces due to the increase in its structural
integrity. In contrast, deformation in the region just downstream of the bifurcation
is independent of the stenosis occlusion.
Figure
8.8
shows maximum principal stress contours along the artery stenosis
plaque and also a reference centreline used later for analysis. Principal stresses may
be defined as the minimum and maximum values of the normal stresses possible in
a material. Its physical meaning can be visualised by considering a material under
stress and looking at the stresses in from different directions. At a certain orientation
all shear stresses are zero and the state of stresses is defined by three normal stress
components only. These three normal stress components are referred to as principal
stresses. Positive stresses are tensile, and negative stresses are compressive and
they exhibit a direction component. A region of high positive maximum principal
stress is found along the border of the stenosis while a region of negative maximum
principal stress resides near the stenosis apex. For the 10 % blockage case, the maxi-
Search WWH ::

Custom Search