Biomedical Engineering Reference
In-Depth Information
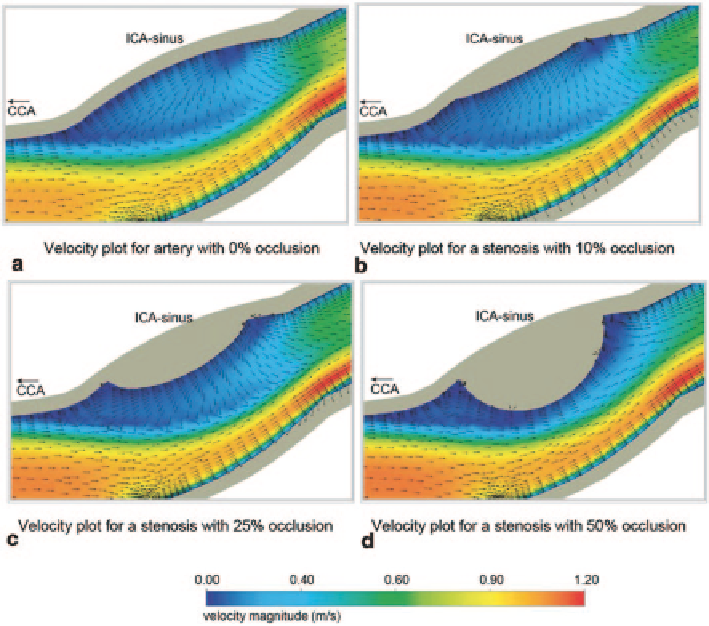
Fig. 8.5
Vector plot and velocity contour plot of carotid bifurcation with different degrees of ste-
nosis. The simulation pertains to an atherosclerotic artery are presented for the (
a
) 0 % or healthy
case; (
b
) 10 % occlusion; (
c
) 25 % occlusion and; (
d
) 50 % occlusion
monitor point; and ECA-outer monitor point. Wall shear stress profiles derived from
simulations based on a rigid vessel wall assumption (no FSI), or a flexible vessel
wall (with FSI) are compared with the work by Tada and Tarbell (2005). In general,
the comparison of no-FSI with FSI shows a 5 % discrepancy in the peak wall shear
stress. Figure
8.4a
-
e
show that the wall shear stress profiles have similar shapes to
the blood flow pressure waveform. The effect of blood vessel compliance reduces
the wall shear stress peak slightly at each monitoring point.
Figure
8.5
illustrates blood flow patterns in the healthy and varying stenosed
carotid bifurcations. The occlusion in the arterial lumen have been deliberately ex-
aggerated to highlight its effects on the blood flow, stresses and deformation. In
Fig.
8.5a
, representing a healthy carotid bifurcation, the blood flow separates at the
terminal end of the CCA, and forms a recirculation zone inside the ICA sinus. This
recirculation zone is located near the outer wall of the sinus, and is relatively large
compared to the diameter of the sinus. The recirculation zone ends with a reattach-
ment point around the distal end of the sinus. Blood motion inside the recirculation
zone is slow and reverses. Consequently, wall shear stress in this region is also very
Search WWH ::

Custom Search