Biomedical Engineering Reference
In-Depth Information
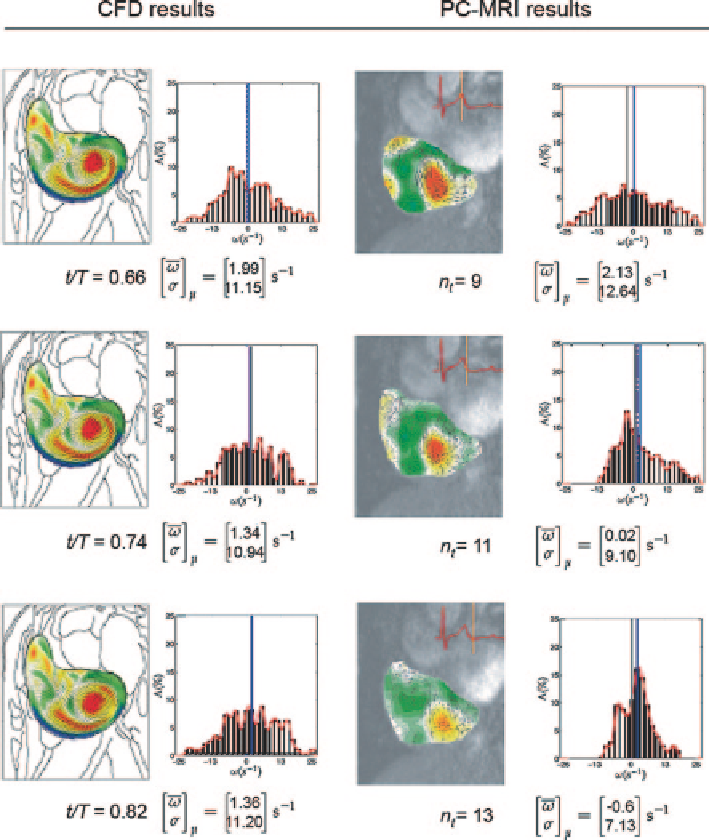
Fig. 7.34
Velocity and vorticity fields based on computational (CFD) and experimental (PC-MRI)
results
of swirling flow in the right atrium (RA). Although we have verified phase-con-
trast-MRI flow mapping with CFD, further comparison of the two flow modes
can be performed based on variation of vorticity interrogation size and resolution
of the flow fields to understand the effects of flow measurement and visualisation
reliability (Wong et al. 2010b).
From a fluid mechanics perspective, blood swirling is caused by the interaction
between the two paths of flow from the inlets (IVC and SVC). In Fig.
7.30
, the gen-
eration and suppression of vortex structures in the right atrium flow is dynamically
Search WWH ::

Custom Search