Biomedical Engineering Reference
In-Depth Information
Table 7.7
Fluid properties
used in numerical simulation
Parameters
Value
Units
Dynamic viscosity
3.5 × 10
−3
Pa
Density
1050
kgm
−3
Entrance velocity
0.04377-8.088
cms
−1
Exit velocity
0-8.33
cms
−1
Pressure
0-100
Pa
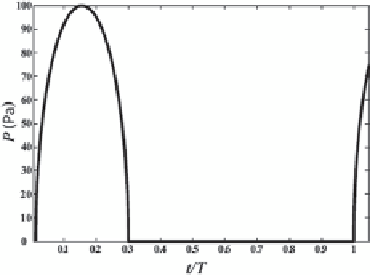
Fig. 7.25
Plot of pressure
versus time
ues for Reynolds number in the cerebral artery has a range of 100-300, and is less
than 30 within the aneurysm (Kim et al. 2010b). To model the unsteady nature of the
flow field, transient CFD using ANSYS CFX was performed. A rigid wall condition
is assumed.
Flow in the vessel is simulated from the early-systole state to end diastolic
state of the cardiac cycle
T
based on an idealistic physiological waveform (refer to
Fig.
7.25
). The model is simulated for one cardiac cycle
T
from 0 to 1. The pressure
starts from zero, and the peak pressure and flow rate occurs at
t/T
= 0.15. The pres-
sure then reduces to zero again at
t/T
= 0.3 and then continues at zero pressure till
t/T
= 1. This pressure variation is repeated in the subsequent cycles.
7.4.4
Aneurysmal Flow Results
Streamline tracing is used to deduce the path of the blood flow. A clearly defined
large-scale vortex is present in the aneurysm sac as shown in Fig.
7.26
. The results
show that an aneurysmal vortex reduces in strength after stenting at time steps
t/T
= 0.2, 0.5 and 0.6. Figure
7.27
presents the counter-clockwise vortices in the
aneurysm sac using vorticity and velocity vector fields. In the non-stented artery, a
large-scale vortex exists in the aneurysm sac. When stented, the vortex decreases
as demonstrated by its lower vorticity values. The pressure gradient Δ
P
and shear
strain rate
γ
is characterised by using a monitor point at the centre of the aneu-
rysmal sac (indicated by a crosshair in the flow field plots). The pressure gradient
and shear strain rate fields can give a quantifiable indication of the vortex differ-


Search WWH ::

Custom Search