Biomedical Engineering Reference
In-Depth Information
and we see that total acceleration (i.e. sum of the local
acceleration
and
convection
)
of the fluid is driven by the pressure gradient in the
x
-direction. The negative sign
denotes that a positive pressure produces a decrease in acceleration, and vice-versa.
For a steady flow, we get
∂
u
∂
P
=−
ρ
u
(5.17)
∂
x
∂
x
convection
pressure
and when this is integrated along the streamline, produces Bernoulli's equation
which we have seen from Chap. 4. For example,
2
2
∂
u
∂
=− ⇒ +
1
P
Px
()
u x
()
2
PU
∞
∞
u
= +
∂
x
ρ
∂
x
ρ
ρ
2
where
P
∞
is the upstream pressure, and
U
∞
is the freestream velocity. If we set the
upstream velocity to
U
∞
= 1 m/s and a radius of
R
= 1 m the above equation becomes
2
ρ
ρ
1
2
2
Px
()
−= − = −−
P
(
U
u x
())
1
1
∞
∞
2
2
2
x
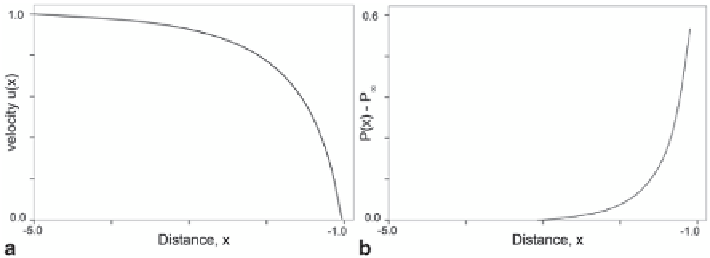
Along the streamline, the velocity profile
u
(
x
) and the acceleration is plotted in
Fig.
5.9
. The velocity drops very rapidly as the fluid approaches the bifurcation.
At the bifurcation midpoint, the velocity is zero (stagnation point) and the surface
pressure is a maximum. The pressure difference
p
(
x
) -
p
atm
demonstrates that the
pressure increases as the fluid approaches the stagnation point. With the density
ρ
set to 1 kg/m
3
it reaches a maximum value of 0.5, i.e.
p
stag
-
p
atm
=
2
(1 / 2 ) ρ
∞
as
u
(
x
) → 0 near the stagnation point.
The total acceleration profile depicted in Fig.
5.10
also shows strong decelera-
tion of the fluid as it approaches the cylinder. The maximum deceleration occurs at
x
= − 1.29 m with a magnitude of − 0.372 m/s
2
.
Fig. 5.9 a
Velocity profile
u
(
x
) along the stagnation streamline.
b
Pressure difference profile
P
(
x
)
- P
∞
along the stagnation streamline


Search WWH ::

Custom Search