Java Reference
In-Depth Information
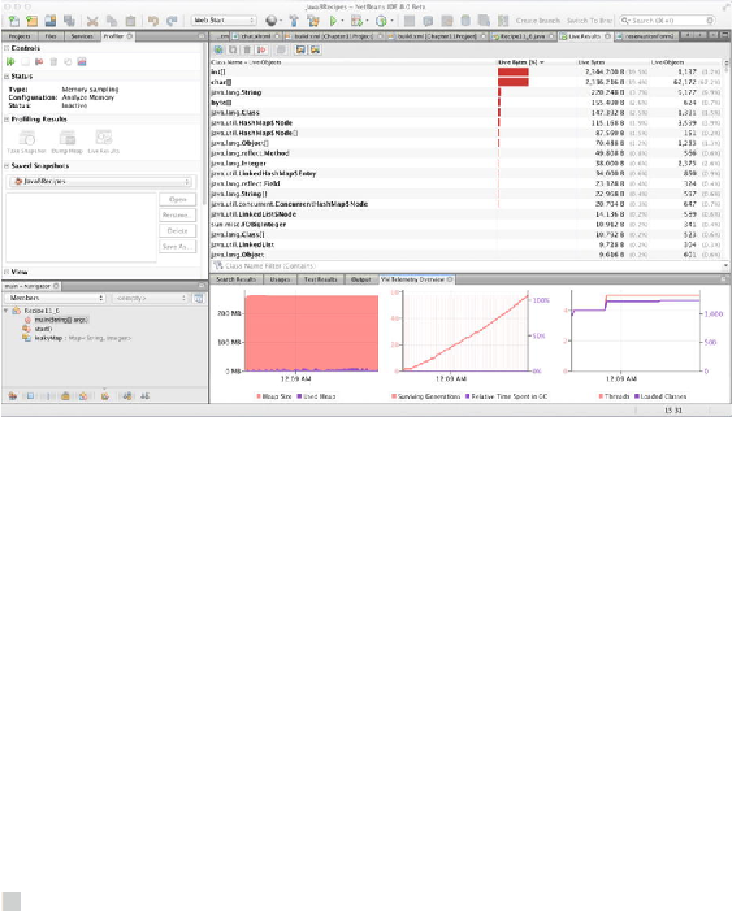
Figure 11-2
.
NetBeans Profiler results
How It Works
Adding the flag to log garbage collection in solution 1 will cause your Java application
to write minor and major garbage collections information into a log file. This allows
you to “reconstruct” in time what happened to the application and to spot probable
memory leaks (or at least other memory-related issues). This is the preferred
troubleshooting method for production systems, as it is usually lightweight and can be
analyzed after the fact.
Solution 2 instead involves using an open source tool that comes installed with
NetBeans IDE. This tool allows you to profile code while it is running. It is a great tool
to understanding
in situ
what's occurring within your application, as you can see real-
time CPU consumption, garbage collections, threads created, and classes loaded.
This recipe barely scratches the surface of the NetBeans profiler. See the online
Note
Before you can use the NetBeans profiler, you must calibrate the target JVM.
To do so, open the Manage Calibration Data dialog within NetBeans and select the JVM