Biology Reference
In-Depth Information
Chapter 2
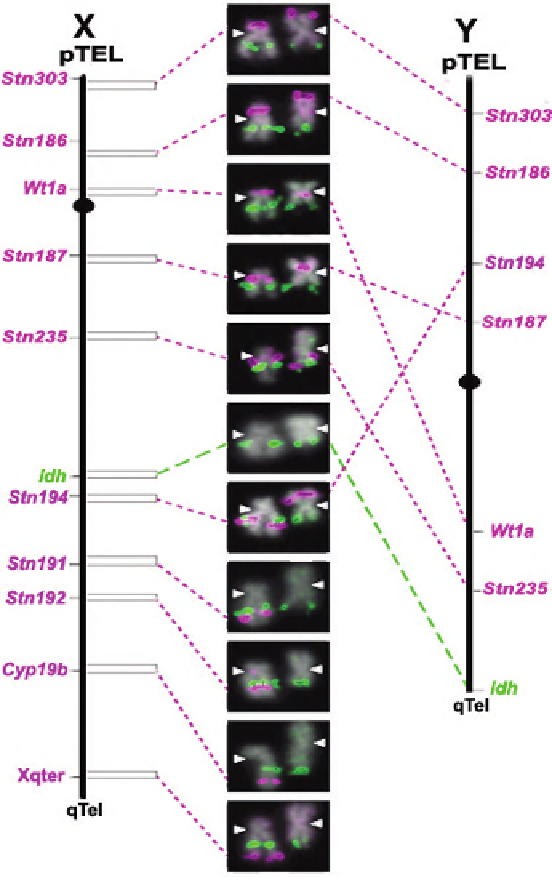
Fig. 5.
FISH-based cytogenetic maps of X (left) and Y (right) chromosomes of
Gasterosteus
aculeatus
. Each FISH section (center) contains the X and Y from a single metaphase spread, to
which
Idh
and an additional probe are hybridized. The position of the centromere is identifi ed
with a white arrowhead. Dashed lines joining the X map to the FISH section indicate the BHC
probe used in each section and those to the Y cytogenic map indicate the physical interval to
which each FISH probe hybridizes. The black circles represent the positions of the centromeres.
Note the deletion of
cyp19b
in the Y (from Ross and Peichel. 2008, with permission by Genetic
Society of America)