Biomedical Engineering Reference
In-Depth Information
r
t
Y
Δ
r
V
P
t
X
Y
Y
X
X
r
t+
Δ
t
Y
t+
Δ
t
X
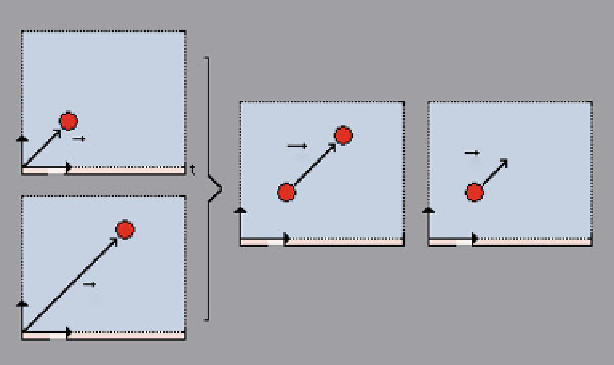
Fig. 9.1
Principle for both PIV and PTV (adapted from [
24
])
where
N
is the number of instantaneous velocity measurements,
u
and
v
are the
time-average mean velocity components of the particle in the
x
and
y
directions,
respectively.
9.2.2 PIV vs. PTV Methods
The density of trace particles in the images determines the most suitable PIV
methodology to calculate the velocity fields. For high concentration of particles,
i.e. the interrogation window contains at least three particles, the method is known
as high-image-density PIV mode (see Fig.
9.2
)[
1
]. Several researchers consider
this method as the most reliable way of determining the velocity field which is
estimated by using a statistical technique known as cross-correlation. It is described
with much more detail elsewhere [
24
,
27
], the overall method being known as PIV
cross-correlation, or simply PIV.
In some specific situations such as physiological fluids with high concentrations
of cells, the amount of tracer particles captured within the fluid is often low (see
Fig.
9.2
). One way to overcome the problem of this particular condition is to
measure the displacements by tracking individual particles or cells (see Fig.
9.3
).
This low-image-density PIV methodology is often referred to as particle tracking
velocimetry (PTV) or as single particle tracking (SPT) [
1
,
44
]. By using this method
detailed quantitative information can be obtained on the motion of particles and
cells flowing within the working fluid. PTV is, however, limited in its ability to
compute automatically particle trajectories, especially when there are multiple
collisions of particles or cells. One way to overcome this limitation is by using
manual tracking methods.
Search WWH ::

Custom Search