Biomedical Engineering Reference
In-Depth Information
Fig. 8.17
TF of a
polychromatic CSI system
Measured
Frequencies
k
z
k
x
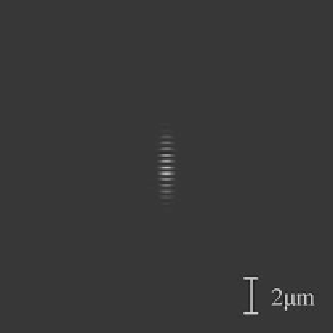
Fig. 8.18
PSF of a CSI
system (positive real part
shown)
where the function
A k
ðÞ
is defined by the convolution,
ð
þ1
G
NA
kðÞG
NA
k
k
0
d
3
k
0
A k
ðÞ¼
ð
Þ
(8.11)
1
For the sake of comparison, the PSF has been computed in Fig.
8.18
for a CSI
with NA
600 nm and a
Gaussian spectral distribution with bandwidth of 100 nm (FWHH@1/
e
2
). It can be
seen that the lateral dimensions of the PSF are approximately half that of the
coherent microscope and the OCT system (Fig.
8.7
and Fig.
8.13
) while the axial
extent is slightly reduced.
Interestingly, the PSF of a laser confocal microscope (configuration shown
in Fig.
8.19
) is directly related to that of CSI [
21
]. In confocal microscopy,
however, the detection process is not usually coherent (i.e., not interferometric)
and consequently the PSF takes the form of the envelope of the PSF of a quasi-
monochromatic CSI of the same NA.
¼
0.55 operating with the same mean wavelength of
l ¼


Search WWH ::

Custom Search