Biomedical Engineering Reference
In-Depth Information
imaging genetics case study, the discovery process starts at the brain imaging
level and is infused with patient- and cohort-specifi c genetics information
throughout the visual analytics session. Results from structural and functional
brain imaging techniques such as CT, MRI, functional MRI (fMRI), and PET
provide the starting point for initial qualitative evaluation. In this fi rst step
patient data can be visually segmented and clustered within the collaborative
visualization environment with its wall-sized display canvas while serving as
an input to further statistical processing. More specifi cally, as the user navi-
gates and conceptually sorts through the data collection obtained via imaging,
auxiliary patient data such as age, gender, and medical record can be linked
and processed in the background to create a hypothesis about imaging genetics
data relationships. For example, the collaborative analysis session may fi rst
conceptually identify candidate brain areas showing distinctive patterns by
visually grouping the associated images. Concurrently, the genetic (SNP) data
for the studied brain regions can be visually colocated such that users may
apply search, threshold, or screening parameters. This approach, in particular,
enabled the swift identifi cation of important linkage relations between brain
areas and particular genes. The genomic and brain pathway information is in
place here to provide additional hints on the SNP. At the same time, the genetic
information and brain areas can be assessed in a 3D brain atlas or 2D anatomic
brain imaging, along with the metabolic pathway image. The brain atlas can
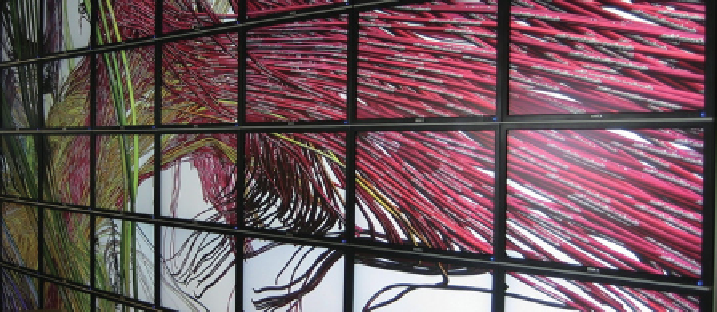
then be interactively adjusted to highlight functional areas. Diffusion tensor
imaging (DTI), subsequent computation of brain tractography, and interactive
visualization of the resulting 3D model serve as additional aids (Fig. 27.12) to
identify disease-related deterioration of pathways.
Finally, researchers verify any discoveries against pharmaceutical data and
clinical trial results and discuss fi ndings using the live notes tools. Throughout
this analysis cycle, online libraries are accessible through the Web portal.
Figure 27.13 provides an annotated overview of the more commonly used
analytics tools that contributed to the collaborative workspace.
Figure 27.12
Visualization of brain tractography using annotated fi ber bundles.
Search WWH ::

Custom Search