Biomedical Engineering Reference
In-Depth Information
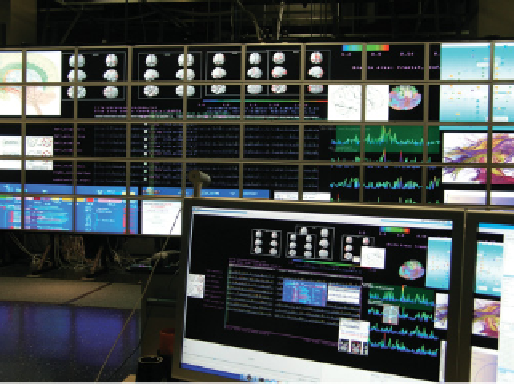
Figure 27.5
Scalable imaging genetics workspace allowing data to be processed
through user-centric view and shared visual analytics space, the wall.
against results obtained with a variety of imaging techniques provides a vital
step in studying brain-related diseases. Given 23 pairs of chromosomes with
over 1 million SNPs on these chromosomes, the conducted research targeting
the alleles (DNA sequences) is based on statistical tests with
p
- values on dif-
ferent genotypes (specifi c genomes, which include both the genes and the
noncoding sequences of the DNA). Given the data size, an effi cient data rep-
resentation scheme is needed to highlight signifi cant values and correlations.
The developed visualization strategy utilizes a 2D and a 3D view, respectively,
to visually combine SNP base-pair position with the associated
p
- value. The
2D view visually connects each SNP position to the respective base- pair loca-
tion with the chromosome represented on the
x
- axis and the corresponding
p
-value mapped to the
y
-axis (Fig. 27.6). Users can then interactively query
for
p
-values and the associated gene at arbitrary base-pair locations by either
moving a search window across the graph or by specifying the boundary condi-
tion for the search space.
To further bracket values of interest, hardware accelerated fi lters can be
applied to recolor the graph in accordance with a user-defi nable color look-up
table. In order to correlate genetic information with the brain, data obtained
for multiple brain regions is exposed concurrently. To provide further insight
into a subrange of base coordinates, a user-defi nable search window can be
placed on the 2D representation, serving as a magnifying glass into a 3D rep-
resentation. This 3D window can be set to cover an arbitrary number of SNP
base-pair positions or number of genes in accordance with user preferences.
Information associated with a particular SNP position as well as statistics on
a particular gene is displayed as the user browses across the chromosome (Fig.
Search WWH ::

Custom Search