Biomedical Engineering Reference
In-Depth Information
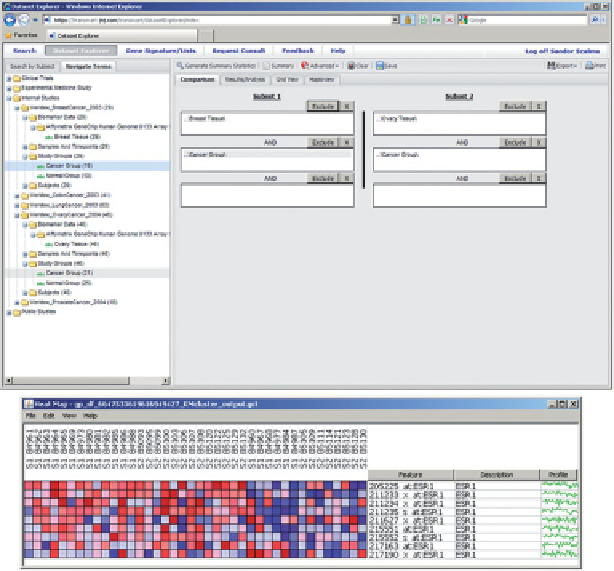
Figure 16.8
Meta-analysis can be carried, as shown. Two cohorts are selected from
two studies which used the same platform to measure biomarkers. In this case gene
expression was measured in a set of breast and ovary tissues (a) and the
ESR1
gene
distribution is shown after
k
-means clustering is applied to the data set using
k
2
stratifying some breast tumor tissue samples (denoted as S1 …) as high expressors
(red) and as low expressors (blue) and similarly for the ovarian tumor tissue samples
(denoted as S2 … ).
=
Institute GeneChip Oncology Database [24], and other sources of gene expres-
sion data.
Search results are presented on a series of tabs. Each tab shows a different
type of information in an appropriate format. Documents are presented with
short summaries, tables of characteristics, and links to the documents. Data
are presented in data tables (Fig. 16.9) and heatmaps. Filters are provided to
enable users to refi ne queries.
16.7.3
Signatures
It is a very complex process to select the appropriate indication for an asset
in the development stage or even during life-cycle management. Many aspects
should be considered, such as a regulatory path for fi ling, potential market
size, differentiability of the therapeutic and experience with and diffi culty to
Search WWH ::

Custom Search