Biomedical Engineering Reference
In-Depth Information
-40
100
-50
50
-60
0
-70
-80
-50
0
2
4
6
8
10
0
0.5
1
Frequency (GHz)
1.5
2
Time (ns)
a
b
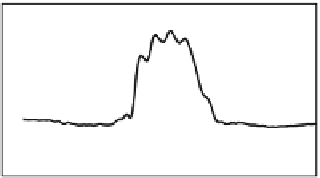
Fig. 20 a
Measured time domain squarer output waveform,
b
spectrum of squarer output
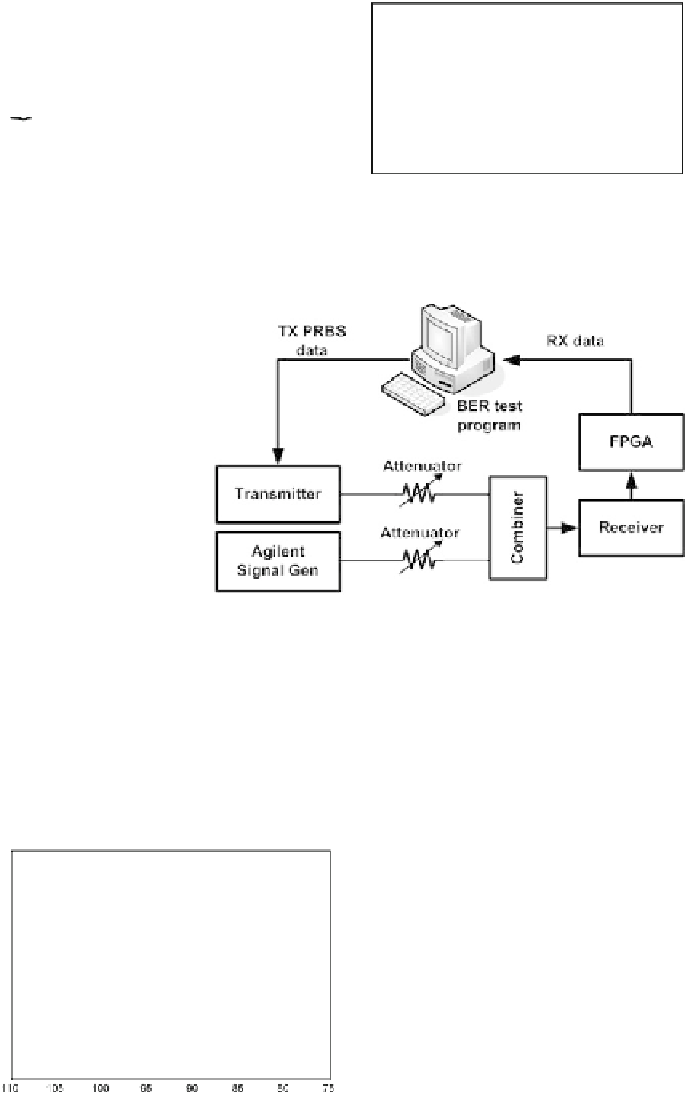
Fig. 21
Measurement setup
for bit error rate (BER) and
signal-interference-ratio
(SIR)
The setup for receiver bit error rate (BER) and signal-interference-ratio (SIR)
measurement is shown in Fig.
21
. For BER measurement, the randomly generated
TX data from the BER software is sent to the UWB transmitter, the TX output is
attenuated with a variable attenuator and then fed into the RX. The received data
is compared with the TX data by a BER algorithm implemented in FPGA. Figure
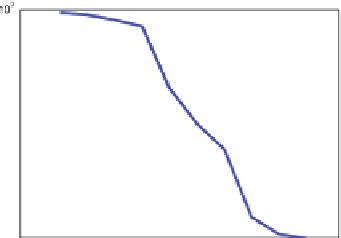
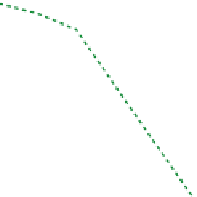
22
a
a
b
Fig. 22 a
Measured bit error rate (BER) at 1 Mb/s.
b
Measured receiver signal-interference-ratio
(SIR)


Search WWH ::

Custom Search