Biomedical Engineering Reference
In-Depth Information
Table 1
Nominal values of the model parameters
S
∞
σ
(S/m)
T
p
Normal breast tissue
10
7
0.15
7
Lesion
54
4
0.7
7
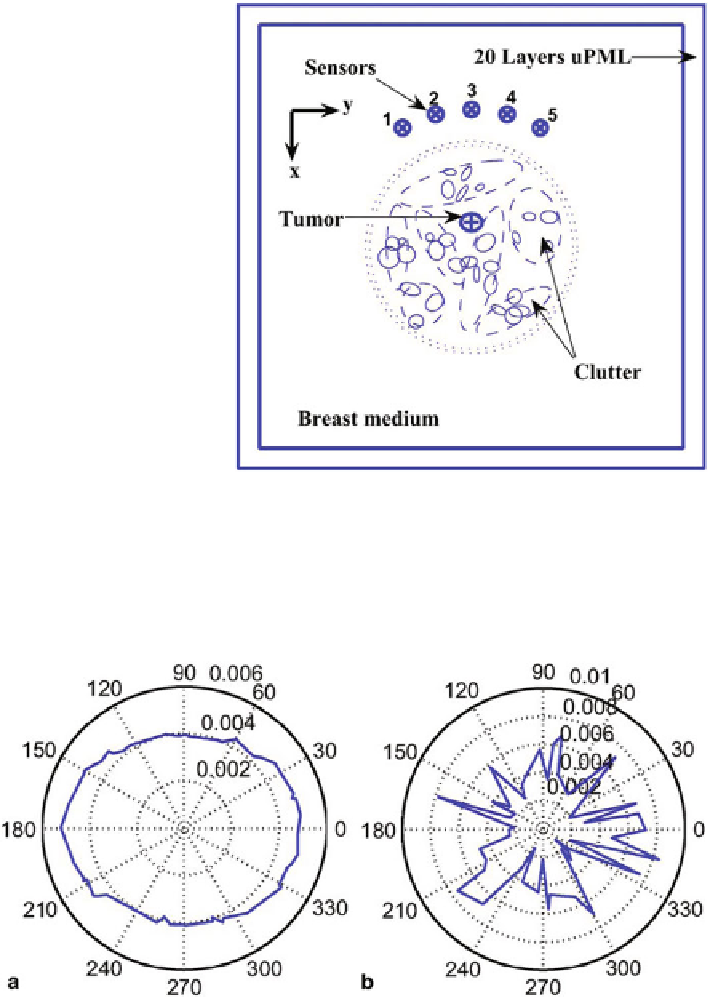
Fig. 1
Configuration of
simulation space. The
transmitter is placed at the
center of the array. Receivers
equidistant from the lesion at
regular intervals
terms with different attenuation coefficients and frequencies (poles). As predicted
by GTD, the attenuation coefficient is a function of the shape of the object while
its frequency is determined by the distance between the scatterer and the receiver.
This representation has interesting applications in UWB microwave radars. Fitting an
Fig. 2 a
Sample of smooth lesion.
b
Sample of rough lesion


Search WWH ::

Custom Search