Biomedical Engineering Reference
In-Depth Information
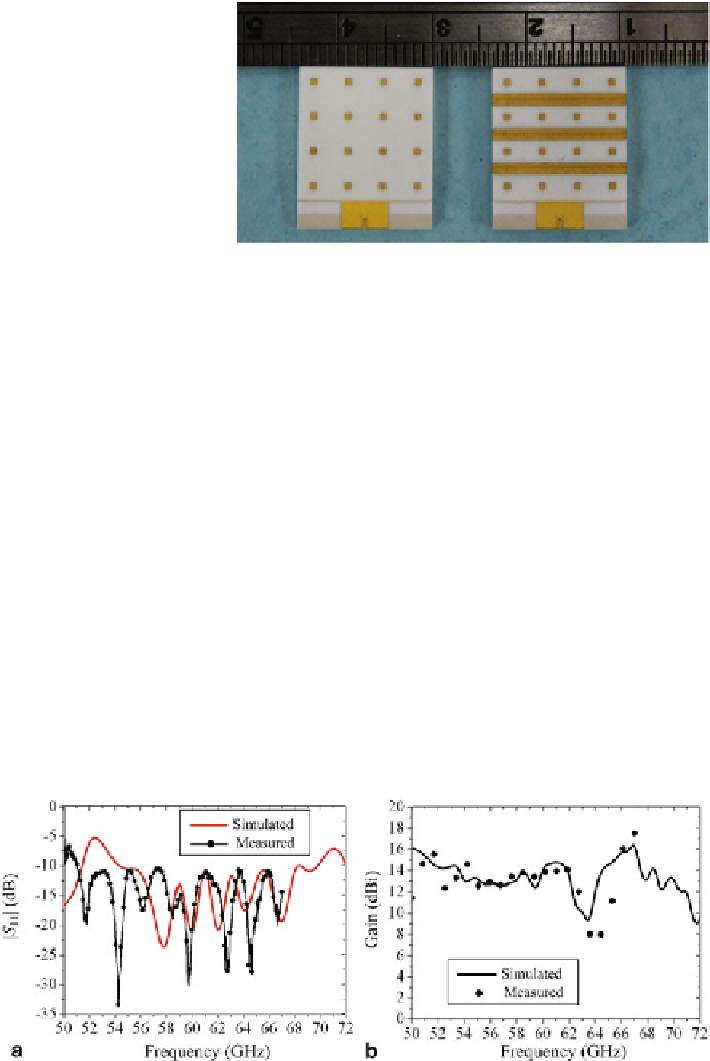
Fig. 14
Photographs of the
proposed antenna arrays.
Left
without the soft-surface
structure.
Right
with the
soft-surface structure (from
[
10
], reprinted with
permission from IEEE)
Experimental Results
Figure
14
exhibits the photographs of the fabricated L-probe patch antenna arrays
without and with the novel soft surface using LTCC process, respectively.
Figures
15
and
16
compare the measured and simulated |
S
11
| and gain of the
antenna array without and with the soft-surface structures, respectively. The mea-
sured frequency band ranged from 50 to 67 GHz is limited by the test cable and
adapter. The measured and simulated results are in good agreement. The simulated
impedance bandwidth for |
S
11
|
<
10 dB are as follows: 26.7 % with respect to the
center frequency of 61.7 GHz (from 53.5 to 70 GHz) for the antenna array without
the soft-surface structure, and 29 % with respect to the center frequency of 62 GHz
(from 53 to 71 GHz) for the array with the soft-surface structure, respectively. The
measured |
S
11
| of the frequency ranges from 51 to 67 GHz for the array without the
soft-surface structure and from 51.5 to 67 GHz for the array with the soft-surface
structure are all below
−
10 dB.
The simulated and measured gain values are 14 and 13.4 dBi for the antenna
array without the soft-surface structure, and 18 and 17.5 dBi for the array with the
soft-surface structure at 60 GHz, respectively. The measured 3-dB gain bandwidth
−
Fig. 15
Measured and simulated |
S
11
| and gain of the antenna array without the soft-surface
structure.
a
|
S
11
|,
b
Gain (from [
10
], reprinted with permission from IEEE)
Search WWH ::

Custom Search