Biomedical Engineering Reference
In-Depth Information
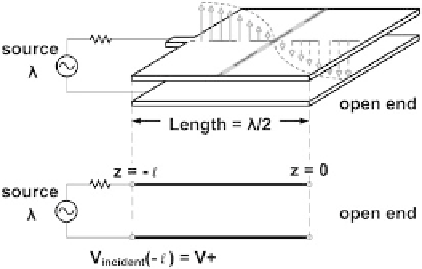
Fig. 12
Simplified lossless
transmission line model of the
patch antenna
A simplified lossless transmission line model for the antenna is adopted for this
analysis. Figure
12
shows the transmission line model corresponding to the patch
antenna along the length axis. We can consider the patch antenna as a very wide
transmission line, with the feed point being the source terminal, while the other
edge behaves as the open end. When the source frequency is exactly at the resonant
frequency, the length of the transmission line is equal to
λ
/2, and a standing wave
pattern is generated by the superposition of the incident wave from the source and
the reflected wave from the load. At this frequency and under these conditions, the
patch antenna radiates at its peak efficiency value. The source end and open end have
the strongest electric fields, and those are the radiation edges. Note that there is an
electrical null located in the center of the length axis (e.g.,
z
l
/2, where
l
is the
length of the patch), shown as the solid shaded area in Fig.
12
. The amplitude of the
standing wave on the transmission line as a function of the length can be written in
the general form [
33
]:
=−
V
+
(
e
−
jβz
e
jβz
),
=
+
V
(
z
)
(4)
where
V
+
is the incident wave magnitude at
z
=−
l
,
β
is the propagation constant
2
π
/λ
, and
Γ
is the voltage reflection coefficient. When the load is open,
Γ
=
1, thus
the magnitude of the standing wave reduces to
| =
V
+
[2
|
V
(
z
)
+
cos (2
βz
)]
(5)
Figure
13
a shows the magnitude plot of three standing wave patterns corresponding
to three different source frequencies. The standing wave pattern according to Eq. 5
changes with frequency, and the corresponding location of the electrical null will
move along the transmission line length as frequency changes. When the source
frequency is lower than the resonant frequency, the electrical null moves toward the
source end. On the other hand, the electrical null will move toward the open end
if the source frequency is higher than the resonant frequency. Consider two taps,
Z
A
and
Z
B
(Fig.
13
a), placed along the edge but at equal distances from the center
of the patch, that monitor the magnitude of the standing wave. By monitoring the
Search WWH ::

Custom Search