Biomedical Engineering Reference
In-Depth Information
-1
10
v
Diversit
y
Gain
SC s
i
gna
l
MRC s
i
gnal
EGC si
g
nal
Branch
1
Branch
2
10
-2
-85
-80
-75
-70
-65
-60
-55
-50
Signal strength (dB)
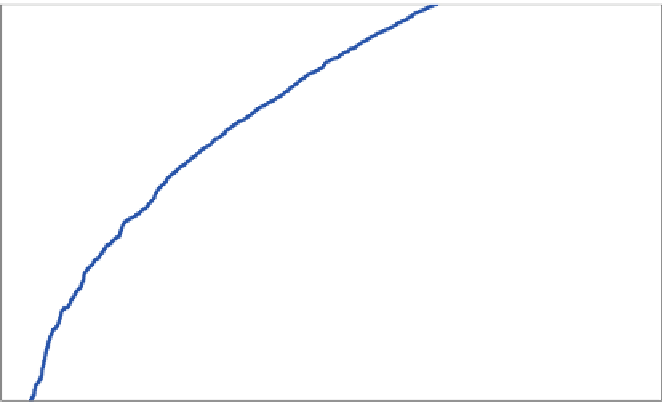
Fig. 4
Cumulative distribution function (CDF) plot for on-body diversity gain (DG) calculation for
head-to-waist channel, when receiver (Rx) is at position 1 and the subject is at location 1
Ultra-Wideband On-Body Diversity Radio Channel
Characterisation
Impact of Branch Spacing on Diversity Parameters
Table
1
lists the DG values (for all three combining techniques),
ρ
e
and the power
imbalance between the two branches for the five on-body channels, for different
spacings between diversity branch antennas, at location 2. In Table
1
, power im-
balance is calculated by using the ratio of the mean power of the two branch signal
envelopes. From Table
1
, it can be seen that, for almost all channels, the correlation
between the diversity branch signals is lower at 0.48
λ
0
than at 0.34
λ
0
, but power
imbalance for 0.48
λ
0
case is increased, that reduces the DG slightly. Thus, 0.34
λ
0
spacing is a good choice, due to the compactness of the diversity antennas and the
relatively high DG. This spacing gives similar performance to the highest possible
spacing; as described in “Mutual Coupling Between Diversity Branch Antennas”,
the mutual coupling remains below
15 dB for all links at this spacing. From the
MRC DG against the antenna spacing for the five channels tested in an indoor envi-
ronment, it can be seen that the DG tends to increase slightly with increased antenna
spacing. There are a few exceptions, however, in which either the power imbalance
is larger or the correlation is high, hence reducing overall DG. From the Table
1
it can be seen that power imbalance seems to be increasing for most of the cases
because of the change in distance between Tx and Rx: one Rx antenna is closer to
the Tx than the other. The variation of MRC-DG with inter-spacing is above 50 %
−


Search WWH ::

Custom Search