Biomedical Engineering Reference
In-Depth Information
300
a
b
c
Type
I
Type
II
Type
III
250
200
150
100
50
1.0
1.1
1.2
1.3
1.0
1.1
1.2
1.3
1.0
1.1
1.2
1.3
Energy (eV)
10
-4
10
-2
PL Intensity (arb. unit)
1
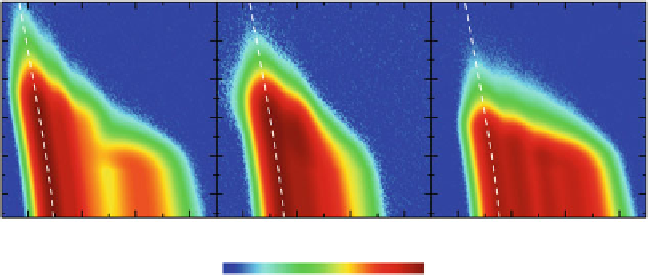
Fig. 3.11
Simulated PL maps
I
(
E
,
T
)ofTypes(
a
)I,(
b
) II, and (
c
) III chirped QDM bi-layers.
Dashed lines
are bandgap variations with temperature according to Varshni's equation with bulk
InAs parameters, linearly shifted to match the lowest-energy cQD peaks. Adapted from [
23
]
in the PL maps are calculated temperature variations of the cQD peak based on
Varshni's equation and bulk InAs parameters; the trend is followed only by cQDs-
related peaks. Despite the simplicity of the approach, the fits predict all the major
characteristics of the measured spectra at all experimental temperatures. Though
we can further improve the simulations by incorporating the recently reported
parameters for the Fan model [
37
], it does not change the qualitative nature of our
conclusions that the WL is the main escape path and that the activation energy falls
somewhere between the ideal case where
2.
Though the chirping schemes described in Sect.
3.5.1
and the demonstrated
optical characteristics in Sect.
3.5.2
employ a QDM bi-layer as the active layer,
the same fundamental concepts can be readily extended to structures with number
of stacks greater than two, or to other material systems in order to increase the
bandwidth or to shift the nominal wavelength to other region of the electromagnetic
spectrum, respectively.
η
i
=
1 and the limiting case where
η
i
=
3.6
Conclusion
Lateral InGaAs quantum dot molecules are grown by solid-source MBE via the
partial-cap and regrowth process using the nanohole-and-mound template. Each
QDM comprises two types of QDs: a cQD located at the nanohole center, and
sQDs surrounding it. Differences in nucleation locations and dynamics result in
cQDs and sQDs having different sizes and degrees of homogeneity: cQDs are
generally taller and more uniform than sQDs. Temperature-dependent photolu-
minescent spectra reflect the geometrical differences: cQDs typically emit at a
low GS energy around 1.05 eV with a narrow FWHM below 30 meV whereas
sQDs emit at about 150 meV higher with a broad FWHM that more than doubles