Biomedical Engineering Reference
In-Depth Information
Type II
Type III
Type I
a
b
c
cQD
2
sQD
2
cQD
1
sQD
1
Energy (eV)
QDM
1
QDM
2
d
e
f
2/26/2.0 &
2/26/1.4
2/15/1.7
&
2/6/1.4
2/25/2.0
1.9/6/1.7
QDM
1
&
QDM
1
QDM
2
QDM
2
170 meV
QDM
1
QDM
2
I
0
=0.45
W/cm
2
2/25/2.0
QDM
1
I
0
/100
stra
dd
led
sta
gg
ere
d
broken
gap
2/6/1.4
QDM
2
2/25/1.4 QDM
1.9/6/1.7
QDM
2
1.0
1.1
1.2
1.3
1.4
1.0
1.1
1.2
1.3
1.4
1.0
1.1
1.2
1.3
1.4
Energy (eV)
Energy (eV)
Energy (eV)
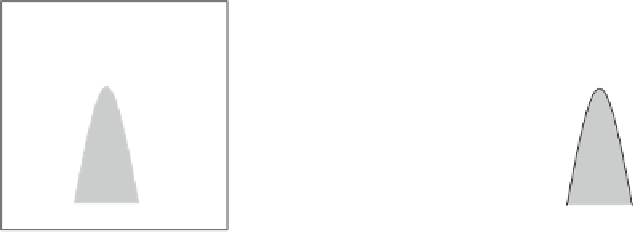
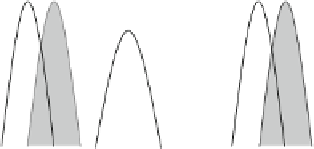
Fig. 3.9
Schematic spectral superposition of (
a
) straddled or Type-I, (
b
) staggered or Type-II, and
(
c
) broken-gap or Type-III chirped QDM bi-layers. The
black
(
gray
)
bar
marks the spectral range
between the cQD and sQD peaks of QDM
1
(QDM
2
). Subscripts 1 and 2 denote the lower and
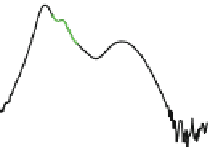
upper QDM layers, respectively. Measured 20 K PL spectra of samples containing single QDM
layer or chirped QDM bi-layer as active layers: (
d
) single 2/25/1.4 QDMs reference (
lower plot
),
and chirped 2/26/2.0 QDM
1
bottom layer and 2/26/1.4 QDM
2
top layer (
upper
); (
e
) single 1.9/6/1.7
QDM
2
(
lower
), single 2/25/2.0 QDM
1
(
middle
), and chirped QDM
1
/QDM
2
bi-layer (
upper
); and
(
f
) single 2/6/1.4 QDM
2
(
lower
), and chirped 2/15/1.7 QDM
1
and 2/6/1.4 QDM
2
bi-layer under
nominal (
upper
) and reduced excitations (
middle
).
Dashed lines
in (
d
-
f
) are multiple Gaussian
function fits. Spectra are offset for clarity. Adapted from [
23
]
2/26/1.4 QDM
2
is sandwiched between the minimum and maximum from the 2/26/2
QDM
1
as expected and provides a smoothening effect of the whole spectrum. The
bi-layer spectrum clearly demonstrates the superposition of individual PL peaks,
indicating that reabsorptions are insignificant.
The staggered scheme or Type-II chirp depicted in Fig.
3.9
b makes use of two
QDM ensembles with similarly wide energetic separations and which are offset
along the energy scale. One possible implementation as shown in Fig.
3.9
b positions
cQD
2
between cQD
1
and sQD
1
,andsQD
1
between cQD
2
and sQD
2
. This can
be achieved by designing the bi-layers to have different capping thickness, to ensure
separated cQD peak energies, but similar regrowth thickness. Figure
3.9
eshows
the PL spectra of the 2/25/2 QDM
1
and 1.9/6/1.7 QDM
2
bi-layer (upper spectrum)
with respect to the controlled, single layers of 2/25/2 QDM
1
(middle) and 1.9/6/1.7
QDM
2
(lower). The lower spectrum shows the almost merged cQDs and sQDs