Biomedical Engineering Reference
In-Depth Information
a
c
e
b
d
5
4
3
2
1
0
250 nm
distance
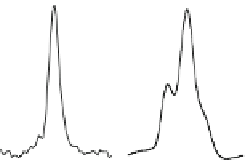
Fig. 3.3
m) and line scans elucidating the evolution of lateral QDMs
grown on the nanohole-and-mound template: (
a
) seed InAs QDs, (
b
) nanoholes and mounds—
formed after partial capping the seed InAs QDs with GaAs, (
c
) cQDs—overgrown on the nanohole-
and-mound template, (
d
) partially-formed QDMs comprising saturated cQDs and non-saturated
sQD, and (
e
) fully-formed QDMs comprising saturated cQDs and sQDs. For the AFM images, the
horizontal direction is the [1
AFM images (1
μ
m
×
0.5
μ
−
1 0] direction, and the
arrows
indicate the sections where line scans
are taken
100-nm GaAs is repeated. After quenching and removing from the growth chamber,
the sample is mounted in a variable temperature optical cryostat and characterized
by PL using the 476.5-nm line of an Ar
+
laser as the excitation source. The PL signal
is dispersed by a 1-m monochromator and collected by a liquid nitrogen cooled
InGaAs detector using standard lock-in detection technique.
The morphology of the QDMs is obtained by quenching the sample as soon as
the regrowth of InAs on the nanohole-and-mound template finishes and probing the
surface in air using AFM in the tapping mode. A typical QDM morphology is shown
in the upper AFM image in Fig.
3.2
.
By varying the regrowth thickness (
z
) it is possible to observe the various stages
of QDM growth. The evolution of the QDM structure—from the seed QD layer to
the complete molecule formation for 2/6/
z
QDMs—is shown in a series of AFM
images and line profiles in Fig.
3.3
. Right after the seed QD formation, Fig.
3.3
a
shows that the base length of a typical QD is approximately 50 nm while the height
is 5 nm. Upon partial capping, the QD height collapses, the base elongates towards
the [1
−
∼
0.2-nm deep appears in the center as
shown in Fig.
3.3
b. After only 0.5-ML InAs regrowth, an indication that a QD is
being formed at the center of each nanohole is shown in Fig.
3.3
c. Usually this sub-
monolayer amount is taken up as a WL on flat GaAs surfaces. This clearly shows
the much lower chemical potentials associated with the nanohole and mound. With
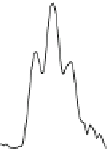
a thicker 1-ML InAs regrowth, a few QDs are formed in addition to the central
QD as shown in Fig.
3.3
d. The QD at the center is referred to as the central QD
(cQD) while those nucleated around it are called satellite QDs (sQDs). With 1-
ML regrowth, cQDs are well saturated while sQDs are only starting to form. And,
finally, with 1.4-ML InAs regrowth, cQDs and sQDs are saturated, forming fully-
grown QDMs as shown in Fig.
3.3
e. Exceeding the saturation, free-standing QDs
1 0] direction, and a shallow dimple