Biomedical Engineering Reference
In-Depth Information
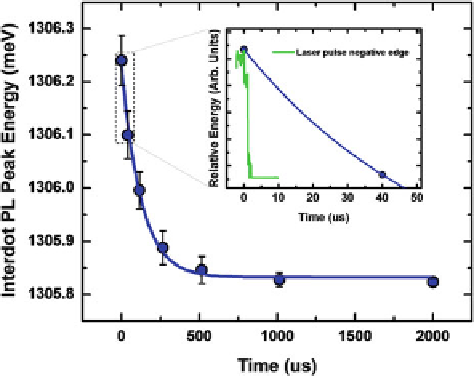
Fig. 11.12
Temporal response of the optically generated electric field,
F
o
. The decay of
F
o
is
measured from the plot of energy of the photon peak with time delay using the gated photon
counting technique. The
inset
shows the turn-off of the triggering laser pulse relative to the decay
of
F
o
from 1 to 100
s. Therefore the data reported here all had the width set to 100
s
to maximize the signal to noise.
To understand the time dependence associated with
F
o
in our QDM device, the
peak photon count corresponding to each delay time was evaluated by fitting the data
to a Gaussian. We then plotted these peaks as a function of the time delay as shown
in Fig.
11.12
and fitted to a first order exponential decay function. From eight sets of
decay plots the average decay time constant was calculated to be 125
s. The
negative edge of the laser pulse that triggered the onset of the decay of
F
o
is also
shown in the inset of Fig.
11.12
. The negative edge of the laser pulse had a turn-off
time of 2-3
±
18
s, which was much shorter than that of the decay rate of
F
o
. Hence
convolution effects were minimal and can be neglected on the measured temporal
response.
As mentioned earlier,
F
o
is dependent on electron and hole generation, tunneling,
and recombination rates, as well as the type and density of traps. Typically for bulk
GaAs the generation rate, tunneling rate, and recombination rates are on the order
of nanoseconds [
40
,
41
]. The longer decay rate of 110-140
sfor
F
o
is due to the
excitons ionizing and the charges remaining within the device region of the Schottky
diode. This happens through trapping of these charge carriers at impurity sites and
material boundaries such as the GaAs/AlGaAs interface, doped or intrinsic GaAs
interface, and WLs.
The formation of
F
o
, however, should be significantly faster. As we excite above
the WL the tunneling and relaxation times should result in a build-up of charge on
the order of nano to picoseconds. We conducted the same experiment as shown in
Fig.
11.10
, and instead observed the rising edge of the optically generated electric