Biomedical Engineering Reference
In-Depth Information
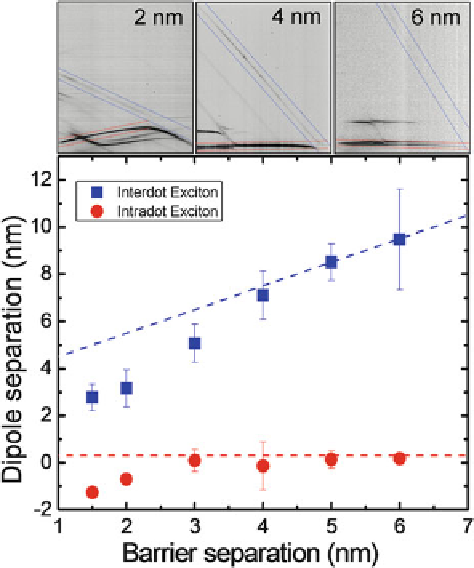
Fig. 11.4
Top panels
show representative spectra from samples with 2, 4, and 6 nm barriers where
the direct and indirect neutral exciton lines are highlighted. The
plot
shows the measured dipole
separation for the direct (
red circles
) and indirect (
blue squares
) exciton with a simple linear dipole
approximation. The
thin dashed lines
show the single QD limit with large barrier
In general, the Stark shift is dependent on, among other details, indium concen-
tration, strain, and barrier profile within the QDM, and could potentially be used as
a spectroscopic tool to gain insight into these properties [
31
-
34
]. In this section, a
continuous shift was observed in the dipole of the intradot exciton with barrier size
that shows that at a low barrier, there is a reversal in the dipole separation, which
arises from highly molecular behavior of the two dots in the QDM. Starting with
nearly single dot behavior for the large barriers, the bottom dot shows a reversal of
its dipole as the barrier between the two dots is decreased, consistent with a simple
picture of the shift of the symmetric molecular wavefunction toward the center of
the molecule which depends on the carrier effective mass. This ability to engineer
the electric field dependence of the excitonic PL in QDMs could prove to be useful
for multiple applications requiring tunable single photon emitters or absorbers. Here
we will focus on utilizing this as a sensitive probe of local electric fields.