Biomedical Engineering Reference
In-Depth Information
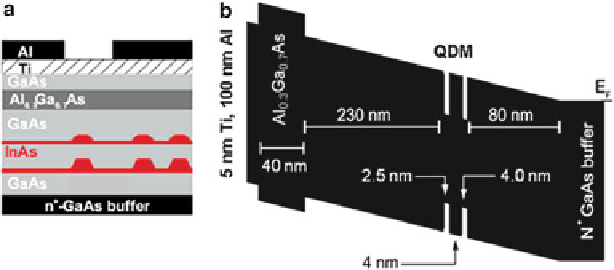
Fig. 11.1
(
a
) QDM device layer sequence. (
b
) Band edge diagram with applied electric field
(e-h) pairs to the lowest available energy states, recombination of the resulting
excitons generates photons that can be used to map the charge and spin states of the
QDMs. The detection of PL is made using a Princeton Instrument's Trivista triple
grating spectrometer along with a Spec-10 CCD detector with a quantum efficiency
of 50-60% over the wavelength range where the QDMs emit. The samples were kept
at cryogenic temperatures using Advanced Research System's closed cycle cryostat.
This system is designed using helium gas to provide the heat exchange between the
expander and the sample, reducing vibrations of less than a micron and allowing for
the spectroscopic study of individual QDMs.
11.4
Field-Dependent Photoluminescence
To observe the various states within the QDM and their behavior with applied field
we use PL as our primary tool. We display the data in a “biasmap” where we plot the
intensity as a function of applied field and PL energy. This is done by taking spectra
at different electric fields and stacking them next to each other to form a contour plot
of electric field vs. PL energy (Fig.
11.2
), where the colors represent the intensity at
a given field and energy. In a typical experiment, laser excitation of the QDM device
creates e-h pairs that may then relax, recombine, or be ionized by the applied field.
If the e-h pairs relax into the QD states within a QDM, they may then recombine. In
these samples, with n
-doped substrates, the typical electric field range over which
PL can be observed is 20-80 kV/cm. On the high field side the loss of luminescence
is due to the electric field-induced ionization of the optically created e-h pairs and
on the low field side the QDs become saturated with electrons from the substrate
and, for excitation above the WL, the PL becomes dominated by the WL emission.
Within the region where PL is visible, signatures of neutral, charged, and multi-
exciton states are observed. Identification of the various excitonic states is aided by
comparison with the field-dependent spectra of a typical, well-understood, single
+