Biomedical Engineering Reference
In-Depth Information
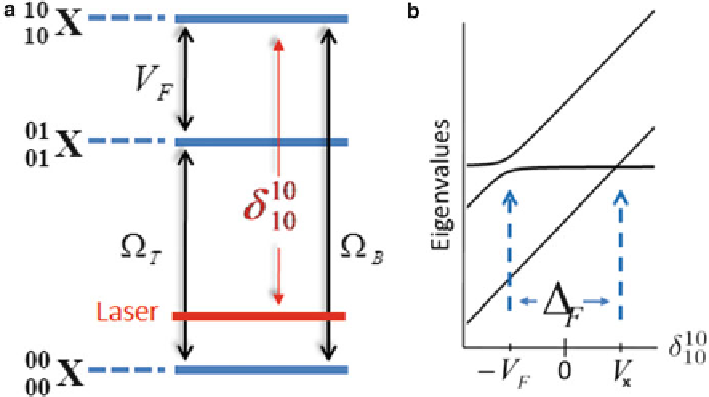
Fig. 10.7
(
a
) Effective level diagram corresponding to truncated Hamiltonian (
10.16
). (
b
)Eigen-
value spectrum as function of energy detuning
δ
X
10
10
, the spectrum shows an anticrossing at
10
10
10
10
2
δ
/
V
F
)=
V
X
. Rolon, J.E., Ulloa, S.E.: Phys.
Rev. B
79
, 245309 (2009). (2011) American Physical Society
=
−
V
F
and a level crossing at
δ
=
V
F
−
(
Ω
laser excitation energy to
h
V
F
, the system would be strongly coupled
by the energy transfer mechanism
V
F
, which is manifest on the strong population
of the exciton state
ω
=
E
1
10
X
+
10
10
X
.However,when
h
ω
≈
E
1
10
X
−
V
X
, the coupling is weaker
and the population lower; with
V
X
having positive or negative values depending
on the relative magnitude of
V
F
and
. Hence, the exciton spectral line splits into
a doublet; one high peaked line separated and a weak narrower satellite spectral
line, both separated from each other by
Ω
1). This result implies that
a better spectral resolution for the FRET signature is achieved for low excitation
power,
Δ
F
(for
|
F
|
2
V
F
. For the parameters used in our simulations,
the splitting in Fig.
10.5
b is about 0.25 meV, with 2
V
F
=
Ω
V
F
and when
Δ
F
14 meV, since the actual
gap is slightly magnified by perturbative corrections arising from charge tunneling
and power broadening (not included in this simple algebraic analysis but included
in the numerical simulations), even for values of
F
0
.
80 kV/cm.
A proof of the arguments given above arises when one calculates the time
evolution of the population (probability density) of the direct exciton states.
Upon diagonalization of the truncated Hamiltonian (
10.16
), the time-dependent
populations are given by
−
2
2
Ω
10
10
2
01
01
2
|
ψ
(
t
)
|
=
|
ψ
(
t
)
|
=
(
1
−
cos
(
Ω
R
t
))
,
(10.17)
R
Ω

