Biomedical Engineering Reference
In-Depth Information
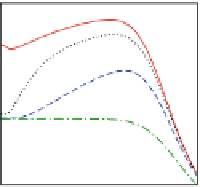
Fig. 9.26
The decay time of
the photoluminescence from a
single DQD with
Δ
=
800
5 meV and three
different values of the
coupling:
V
0
.
600
=
−
0
.
2meV(
red
400
solid line
),
V
1meV
(
black dotted line
),
V
=
−
Δ
= 0.5 meV
3meV(
blue dashed
line
), and
V
=
−
200
8meV
(
green dash-dotted line
)[
52
]
=
−
0
40
80
120
temperature [K]
bright), so we study the evolution of the intensity of the PL,
I
PL
=
n
+
Γ
+
+
n
−
Γ
−
,
where
n
±
are the occupations of the state
, respectively. Additionally,
the values obtained from the numerical simulations are suppressed by the factor
exp
|
Ψ
+
and
|
Ψ
−
(
−
Γ
nr
t
)
, corresponding to thermally activated non-radiative processes [
127
]. We
Γ
nr
=
Γ
(
0
)
set
, corresponding to the exciton escape [
127
]. The PL
decay time is determined as the time when the PL intensity is reduced by the factor
1
exp
[
−
E
a
/
(
k
B
T
)]
nr
e
(the PL decay is not exactly exponential).
In the case of a single DQD structure, we assume that the system under study
is inhomogeneous and optically prepared in the initial state
/
although, as we
mentioned previously, the initial conditions are not very important, if the phonon-
induced thermalization is fast enough. In Fig.
9.26
, we choose a fixed value of
the energy mismatch,
|
+
5 meV, and plot the results for several values of
the inter-dot coupling. At low temperatures, the observed rate is dominated by
radiative recombination, while at higher temperatures non-radiative suppression
plays a major role. The red solid line corresponds to a very weak coupling between
the dots, so that the energy mismatch dominates and the two dots are almost equally
bright. Hence, their radiative rates are similar. Therefore, thermal redistribution
of their occupations leads only to marginal changes in the PL decay time with
temperature. With increasing coupling values (black dotted and blue dashed lines),
the ground state has a considerably increased decay rate; hence, the PL decay is
much faster at low temperatures. At moderate temperatures, the increasing thermal
occupation of the higher, dark state leads to a considerable growth of the PL decay
time until the non-radiative effects become important, which leads to the formation
of a pronounced maximum. This situation changes when the coupling strengths are
higher: in this case, there is no maximum since the energy splitting between the two
states (roughly equal to 2
V
) is large enough to prevent a non-negligible occupation
of the dark state in the relevant temperature range.
In a more feasible case, the PL signal is collected from an inhomogeneous
ensemble composed of DQDs with different fundamental transition energies. The
results for a model in which the values of
Δ
=
0
.
va
ry
across the ensemble according to
the Gaussian distribution with the mean value
Δ
Δ
=
0 and the standard deviation
σ
are shown in Fig.
9.27
(for the initial state
5meV
and show the results for a few coupling strengths
V
, in analogy with Fig.
9.26
.
|
+
). In the left panel, we set
σ
=
0
.