Biomedical Engineering Reference
In-Depth Information
1
Re
F
1
Im
Re
F
1
Im
a
e
F
1
F
1
0.5
0
1
Re
F
2
Im
F
2
Re
F
2
Im
F
2
b
f
0.5
0
1
Re
F
3
Im
Re
F
3
Im
c
g
F
3
F
3
0.5
0
1
Re
F
Im
F
Re
F
Im
F
d
h
|F|
|F|
0.5
0
-0.3
0
0.3
-0.3
0
0.3
t
0
-
t
[ps]
t
0
-
t
[ps]
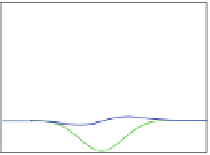
Fig. 9.19
(
a
)-(
c
) Real and imaginary parts (
green and blue lines
, respectively) of the three
contributions
F
n
(
t
0
,
τ
)
to the FWM echo
F
(
t
0
,
τ
)
for short delays, with
τ
=
0
.
23 ps,
V
=
2meV,
V
B
=
1meV,and
σ
Δ
=
1meV.(
e
)-(
g
) As previously, but at
τ
=
0
.
61 ps. (
d
)and(
h
) Real and
imaginary parts of the total signal
F
(
t
0
,
τ
)
, as well as its amplitude, which corresponds to the
measured signal, for the two values of
τ
[
126
]
signal also varies with time
on the picosecond scale (Fig.
9.19
d and h). This leads
to oscillations in the time-integrated four-wave mixing signal (equal to the area of
the echo pulse) at short (picosecond) time scales which are a manifestation of the
optical beats between the two dots forming all the quantum dot pairs (Fig.
9.20
).
The character of the ini
ti
al evoluti
on
of the time-integrated signal depends on the
interplay between
τ
, then the measured signal is a superposition
of the fields emit
te
d by a
ll
DQDs whose energy mismatches
σ
Δ
and
Δ
.If
σ
Δ
Δ
Δ
are spread roughly
within a range
(
Δ
−
σ
Δ
;
Δ
+
σ
Δ
)
. Since the effective energy mismatch depends
on
, the inhomogeneity of fundamental transition energies leads to the spread of
the phase factors, exp
Δ
, which increases with increasing delay time. Due to
this phase distribution the signals emitted by different DQDs interfere destructively
(
i
E
τ
/
h
)