Biomedical Engineering Reference
In-Depth Information
a
b
30
25
20
15
10
5
0
0
1
2
3
4
5
6
7
8
9
0
1
2
3
4
5
6
7
8
9
-
-
hw
(meV)
hw
(meV)
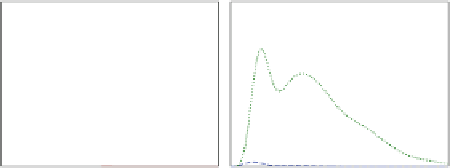
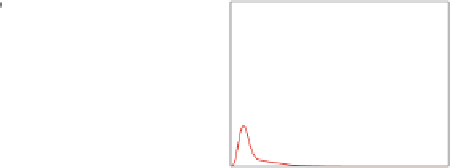
Fig. 9.4
0 from the DP coupling to longitudinal
acoustic (LA) phonons (
green dotted line
) and from the piezoelectric coupling to LA phonons (
red
solid line
) and transverse acoustic (TA) phonons (
blue dashed line
)at
T
The contributions to the spectral density at
ε
=
=
0Kfor(
a
)
D
=
11 nm
and (
b
)
D
=
14 nm
other hand, at the resonance, the wave functions of both states are delocalized (what
leads to a large overlap between them). In consequence, as can be seen in Fig.
9.3
b,
the phonon-assisted relaxation rate has a maximum at the point corresponding to
the energy resonance. Furthermore, the spectral density oscillates. The reason is
the emission of the short wavelength phonons along the direction with the strongest
confinement [
85
]. Because there are two confinement centers along this direction, an
interference takes place and the amplitude of phonon emission has a maximum for
each
D
,where
n
is an integer. The oscillations are clearly reflected
in the behavior of the DP contribution to the relaxation rate at
D
ω
=(
2
n
+
1
)
π
c
/
=
14 nm (Fig.
9.3
d).
In the case of
D
11 nm (Fig.
9.3
c), only one maximum can be seen, because the
period of oscillations is greater than for
D
=
11 nm. On the other hand, the envelope
of the spectral density drops down for large
=
because the high energy (short
wavelength) phonons are not effectively coupled to the relatively weakly confined
electron states. The contributions to the overall magnitude of spectral density are
showninFig.
9.4
a,b. One can see that for small
ω
, the PE coupling dominates
as a mechanism of electron-phonon coupling. On the other hand, DP coupling is
preferred for moderate and high values of frequency. This results from the fact that
the DP coupling is isotropic while the PE coupling is anisotropic and is suppressed
for emission along the
z
direction, which is preferred for higher phonon energies
[
76
]. The properties of spectral density are clearly reflected in Fig.
9.3
c,d. As can
be seen in Fig.
9.3
c, the DP coupling dominates for small inter-dot separations
(large energy splittings). On the other hand, the PE coupling becomes dominant
mechanism for large distances (Fig.
9.3
d).
We also performed calculations for the system containing a single hole. The
two lowest eigenstates have a very small light hole admixture (from 0.5 to 2%
contribution to the total state). The reason is a very weak confinement of light holes
in the QDM. In order to analyze the tunnel coupling between the hole states in
the system we calculated the tunnel parameter
t
as a function of the distance
D
(Fig.
9.5
a). The results for holes show qualitatively different behavior compared
ω