Biomedical Engineering Reference
In-Depth Information
a
b
800
D
= 11 nm
D
= 11 nm
600
795
400
2|
t
|
790
200
785
0
-0.1 -0.05
0
0.05 0.1
-0.04
0
0.04
0.08
e
(mV/A)
e
(mV/A)
c
d
200
50
D
= 11 nm
D
= 14 nm
40
150
30
100
20
50
10
0
0
-0.04
0
0.04
0.08
-0.04 -0.02
0
0.02 0.04
e
(mV/A)
e
(mV/A)
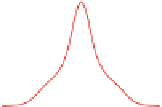
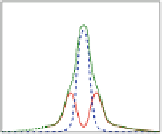
Fig. 9.3
11 nm as a function of the electric field.
Half of the energy splitting at the resonance is equal to the value of the tunnel coupling parameter.
(
b
) Relaxation rate between the two lowest one-electron states at
T
(
a
) The two lowest electron energy levels at
D
=
0K(
red solid line
), 20 K
(
blue dashed line
), and 40 K (
green dotted line
). (
c
,
d
) Contributions to the relaxation rate from the
DP coupling (
red solid line
), PE coupling (
blue dashed line
) and the total relaxation rate (
green
dotted line
)at
T
=
=
0 K for two different inter-dot distances
The two lowest energy levels as a function of the electric field for an electron
are shown in Fig.
9.3
a. The resonance (the point which corresponds to the minimal
splitting) describes the situation when the electron in both states is delocalized.
In order to describe the tunnel properties of the system, we introduce the tunnel
coupling parameter
t
, defined as a half of the energy splitting at the resonance. In
the case of electrons, the value of
t
decays exponentially with an increasing inter-dot
separation
D
.
The quantity describing phonon-related dynamics is a phonon-assisted relaxation
rate
. We calculated the phonon-assisted relaxation rate between the first excited
state and the ground state for two different distances between the dots: at
D
γ
=
11 nm
and at
D
14 nm. All the material parameters, as well as the exact system geometry
are described in [
76
,
77
]. We took into account the carrier-phonon coupling by
piezoelectric field (PE) as well as by deformation potential (DP). The results of
the total phonon-assisted relaxation rate (defined as a sum of DP coupling and PE
coupling contributions) at three different temperatures is presented in Fig.
9.3
b. The
temperature dependence has been modeled using the Bose-Einstein distribution of
phonons. Relaxation rates are large near the energy resonance and become small for
the electric fields far from the resonance point. The interpretation of this behavior
is based on the Fermi golden rule where the main role is played by spectral density
of the phonon reservoir (see Sect.
9.2
;Fig.
9.4
a,b). The magnitude of the spectral
density critically depends on the spatial overlap between the wave functions. On the
=