Biomedical Engineering Reference
In-Depth Information
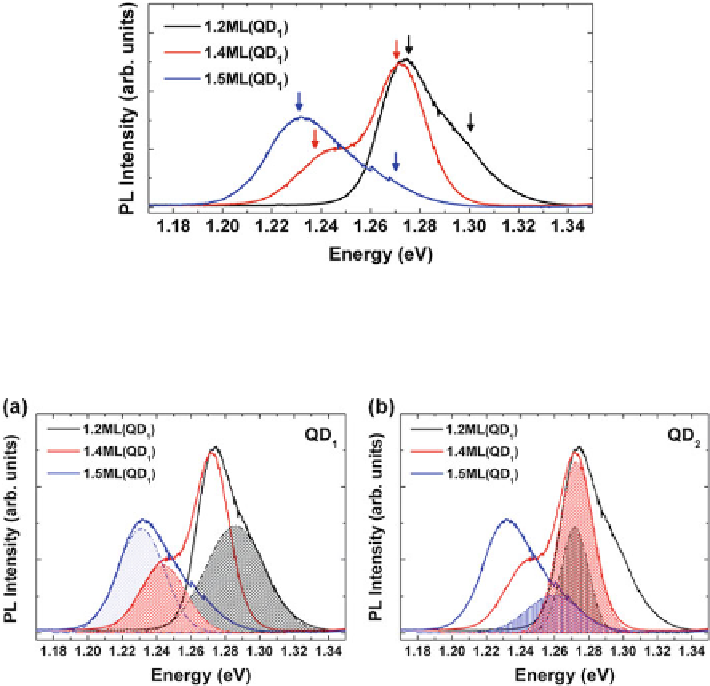
Fig. 1.4
Photoluminescence spectra for the three vertical QDMs designs fabricated.
Black
,
red
,
and
blue curves
correspond to 1.2, 1.4, and 1.5 ML of InAs deposited into the nanoholes,
respectively. The
arrows
in the figure point out the two families of QDs formed on each sample.
Adapted from [
31
]
Fig. 1.5
Photoluminescence emission (
filled areas
)ascribedto(
a
)QD
1
and (
b
)QD
2
nanostruc-
tures. A clear tuning effect on the emission of QD
1
is obtained independently of the emission of
QD
2
, which shows similar emission for all the samples. Adapted from [
31
]
InAs increases, the emission energy of QD
1
decreases, further demonstrating the
preferential nucleation of InAs into the nanoholes. Analogously, Fig.
1.5
bshows
as filled areas the three PL emission spectra ascribed to the nanostructure QD
2
.
In this case, the emission energy is similar in all cases indicating that the size
of QD
2
remains constant despite the varying amounts of InAs material nucleated
underneath. The emission energies ascribed to QD
1
and QD
2
in these PL curves are
listed in Table
1.1
. The arrow in this table highlights the tunability of the energy
emission of QD
1
as a function of InAs material deposited into the nanoholes.
Altogether, these results show that the preferential nucleation of controllable
amounts of InAs material into a nanoholes template formed by the droplet etching
technique allows for a deliberate designing of symmetric or asymmetric vertical
QDMs where the emission of one QD can be tuned with independency of the other.