Biomedical Engineering Reference
In-Depth Information
a
b
8
7
d
CdSe
=3.5 nm, n
ZnS
=0
d
CdSe
=2.1 nm, n
ZnS
=2
d
CdSe
=3.0 nm, n
ZnS
=2
d
CdSe
=4.1 nm, n
ZnS
=2
d
CdSe
=5.2 nm, n
ZnS
=2
1
6
5
4
3
2
3
2
5
4
1
0
4
8
12
16
20
Porphyrin-to-QD Molar Ratio x
c
0,15
1
3
0,10
2
0,05
4
5
0,00
0
4
8
12
16
20
Porphyrin-to-QD Molar Ratio x
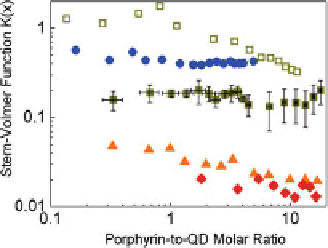
Fig. 4.20
(
a
), calculated Stern-Volmer function
K
(
x
)(
b
)andFRET
efficiencies calculated using Eq. (
4.2
)(
c
) for an uncapped CdSe QD (
open markers
) and CdSe/ZnS-
capped QDs (
solid markers
) of various sizes upon titration by (m-Pyr)
4
-H
2
P as function of the
molar ratio
x
Stern-Volmer plots
I
0
/
I
(
x
)
=
[
C
Porphyrin
]/[
C
QD
] in toluene at 295 K :
1
(
open green square
)—
d
CdSe
=
3.5 nm,
n
ZnS
=
0;
2
(
blue circle
)—
d
CdSe
=
2.1 nm,
n
ZnS
=
2;
3
(
filled green square
)—
d
CdSe
=
3.0 nm,
n
ZnS
=
2; 4 (
orange triangle
)—
d
CdSe
=
4.1 nm,
n
ZnS
=
2; 5 (
red diamond
)—
d
CdSe
=
5.2 nm,
n
ZnS
=
2. Adapted from [
63
]
Tabl e 4. 2
Mean
K
SV
(
x
)
values and PL quenching rate constants
k
q
for QDs of various
CdSe core diameters
d
CdSe
upon titration by (m-Pyr)
4
-H
2
P (toluene, 295 K)
d
CdSe
(nm)
4.3
5.2
6.3
7.3
K
SV
(
x
)
0.65
±
0.10
0.115
±
0.015
0.055
±
0.007
0.020
±
0.003
k
q
(ns
−
1
)
0.041
±
0.016
0.0057
±
0.0023
0.0027
±
0.0016
0.0015
±
0.0009
only due to the molecular properties of H
2
P but also due to a local change in the
ligand shell on the QD surface upon assembly formation.
Experimental data for mean
values and PL quenching rate constants
k
q
evaluated from the results presented in Fig.
4.20
are collected in Table
4.2
.As
far as the QD PL quenching in “QD-H
2
P” nanoassemblies is due to at least two
contributions (FRET and non-FRET),
K
SV
(
x
)
(presented also in Fig.
4.20
b) and
k
q
values have been corrected for the FRET contribution (shown in Fig.
4.20
cbut
which are relatively small).
K
SV
(
x
)