Biomedical Engineering Reference
In-Depth Information
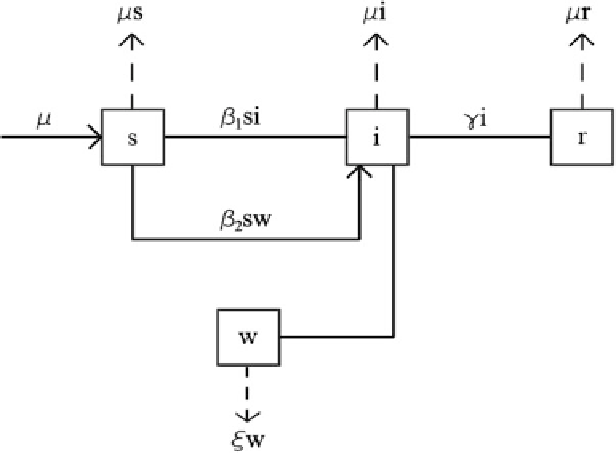
Fig. 3
Flow diagram of model (
15a
)-(
15d
);
broken lines
indicate death
Here we consider a simple SIR model with added compartment W that tracks
pathogen concentration in water. We follow a recent model studied by Tien et al. [
9
]
(see also the references in [
9
]). The model includes four variables: susceptible (s),
infected (i) and recovered (r) individuals, and pathogens (w). In the nondimensional
form where
s
+
+
=
i
r
1, the four variables satisfy the following system of equations:
s
=
μ
−
β
1
si
−
β
2
sw
−
μ
s
,
(15a)
i
=
β
1
si
+
β
2
sw
−
γ
i
−
μ
i
,
(15b)
w
=
ξ
(
i
−
w
)
,
(15c)
r
=
γ
i
−
μ
r
,
(15d)
where
β
1
is the water reservoir-person contact rate,
β
2
is the person-person contact
rate, 1
/
γ
is the infectious period, 1
/
ξ
is the pathogen lifetime in the water reservoir,
and
μ
is the birth/death rate. The phase space for the system (
15a
)-(
15d
)is
Ω
=
{
(
s
,
i
,
w
,
r
,
)
;
s
≥
0
,
i
≥
0
,
0
≤
w
≤
i
,
r
≥
0
,
s
+
i
+
r
=
1
}.
(16)
Figure
3
illustrates the flow diagram represented by model (
15a
)-(
15d
).
Some waterborne diseases are seasonal. An example is the epidemic of cholera
in the nineteenth century London [
10
]. To model these cases we take
β
1
,
β
2
and
ξ
to be periodic functions in
t
with period
ω
. Thus, we shall consider the system
Search WWH ::

Custom Search