Biomedical Engineering Reference
In-Depth Information
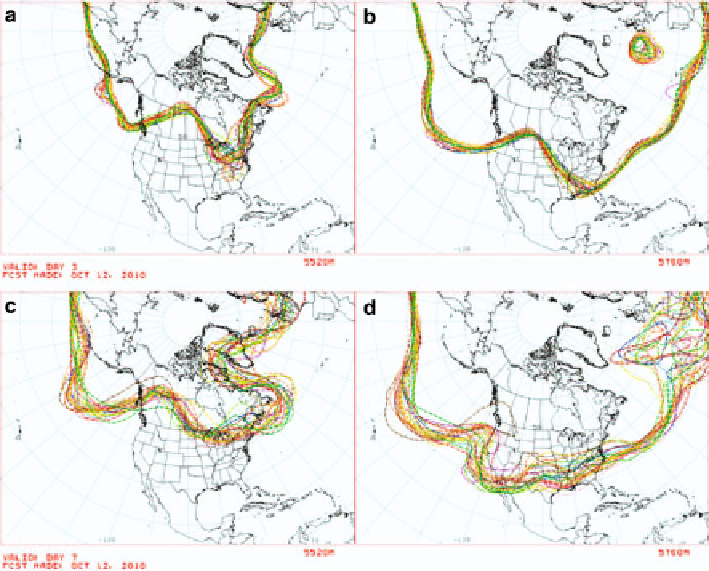
Fig. 3
Ensemble forecasts. Shown are contours of the 500 hPa geopotential height over North
America for forecasts started on Oct. 12, 2010. The
top panels
show the predicted values after
3daysandthe
bottom panels
, after 7 days
of a forecast obtained by running the weather model for 3 days (top panels) and
7 days (bottom panels). Roughly speaking, the maps show the predicted locations
where half the atmosphere's mass is above 5,520 m (left panels) and 5,760 m (right
panels).
1
Of greatest interest here is how the maps illustrate the magnitude of forecast
uncertainty, which varies considerably in space as well as time. Because of the
chaotic dynamics, the forecast uncertainty generally is larger at 7 days than at
3 days. The 5,760-m contours (right panels) show considerable spread over the
North Atlantic Ocean at 7 days, corresponding to especially large uncertainties in
the forecast locations of the 500-hPa geopotential height.
1
The geopotential, Φ
(
z
)
, is the work needed to raise a unit mass a vertical distance
z
from mean
sea level and accounts for the variation of the earth's gravitational field with latitude and elevation.
The geopotential height is
80665 m s
−
2
is the global average of gravitational
acceleration at mean sea level. For more details, see Chap. 1 of [
12
].
Φ
(
z
)
/
g
0
,where
g
0
=
.
9
Search WWH ::

Custom Search