Biomedical Engineering Reference
In-Depth Information
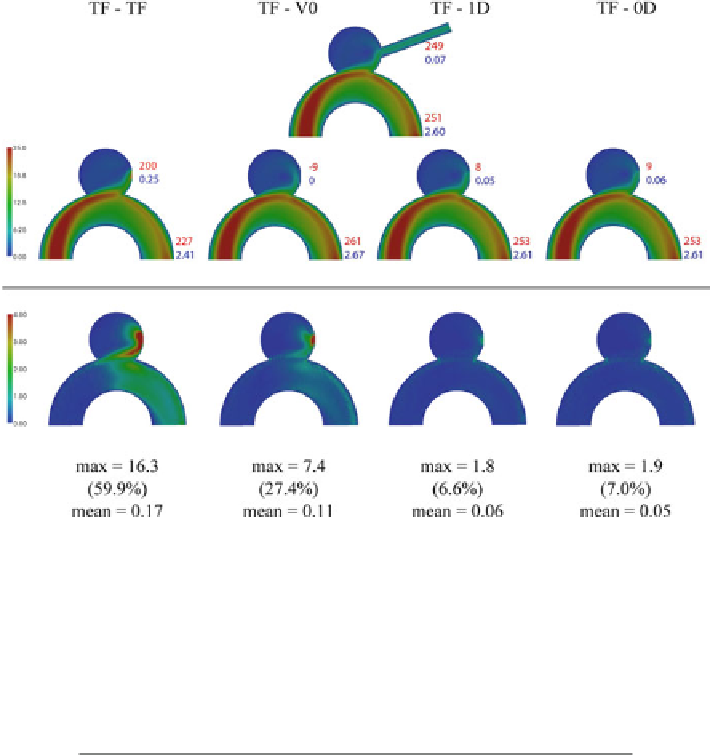
Fig. 9
Velocity magnitude (cm/s) for stead-state simulations of the geometry with side-branch and
traction-free boundary condition and the clipped geometry with different boundary conditions and
its differences. The maximum difference is calculated on the cross-section, using the maximum
value for the percentage. The values in the figure are the pressure drop with the inflow (
red
)and
flow rate (
blue
)
Tabl e 2
WSS magnitude differences (dyn/cm
2
) for the geometry with side-
branch and traction-free boundary condition and the clipped geometry with
different boundary conditions
TF - TF
TF - V0
TF - 0D
TF - 1D
Max = 23.5
Max = 13.6
Max = 15.0
Max = 15.0
(81%)
(46.8%)
(51,7%)
(51.7%)
Mean = 4.3e
4
The maximum difference is calculated on the whole geometry, using the
maximum value for the percentage
−
4
Mean = 8.2e
−
4
Mean = 4.4e
−
4
Mean = 4.8e
−
was chosen to be imposed at the end of the side-branch for comparison purposes,
here considering the fluid to be fully developed at the branch outflow. From the
velocity results of Fig.
9
it is possible to infer that the two reduced models are
good approximations of the side-branch, since the differences between imposing
these reduced models directly in the clipped configuration and accounting for the
side-branch are very small. The disparity between the pressure drops obtained
using the reduced 1D and 0D models and the side-branch, are related to the
pressure drop across the side-branch. In fact, the pressure drop across the side-
branch is 258 dyn/cm
2
, which is approximately that found for the reduced models.
Search WWH ::

Custom Search