Biomedical Engineering Reference
In-Depth Information
12000
12000
% ILI visit v/s Twitter users
Fitted line
% ILI visit v/s Facebook users
Fitted line
11000
10000
10000
Outlier
8000
9000
8000
6000
7000
4000
6000
2000
5000
4000
0
1
1.5
2
2.5
3
3.5
4
4.5
5
1
1.5
2
2.5
3
3.5
4
4.5
5
% ILI visit
% ILI visit
Fig. 2.
Number of OSN users per week versus percentage of weighted ILI visit by CDC. (Twitter
on left and Facebook on right)
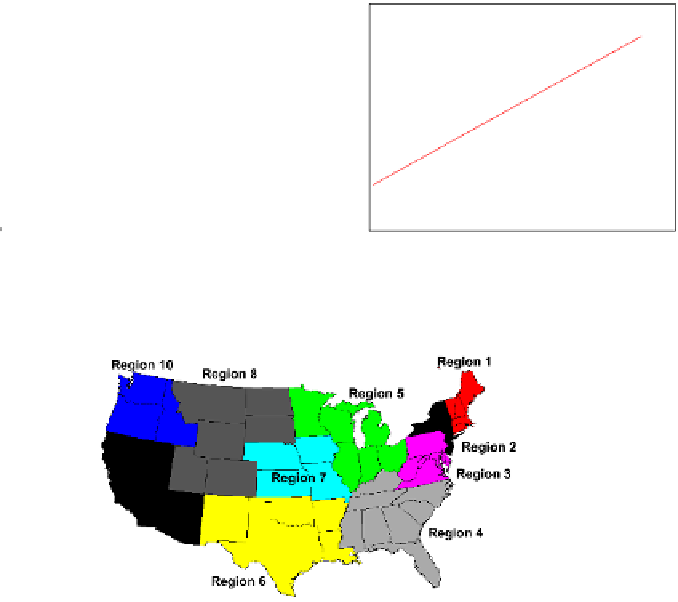
Fig. 3.
Regionwise division of USA into ten regions by United States Health and Human Services
This increase in the number of users posting about the flu is accompanied by an in-
crease in the percentage of weighted ILI visits reported by CDC in the same week. The
marked outlier present in the Twitter data as identified in Figure 2 is consistent with
Google Flu Trends data when high tweet volumes were witnessed in the week starting
January 2, 2011. The CDC has divided the United States into 10 regions as shown in
Figure 3. The CDC publishes their weekly reports on percentage weighted ILI visits col-
lated from its ten regions and aggregates then for United States. Figure 4 compares the
OSN dataset with CDC reports with and without text classification for each of the ten
regions defined by the CDC and for the entire United States as a whole. We observe that
the correlation coefficients have significantly improved with text classification, across
all the regions and USA overall. Thus our text classification techniques play a vital role
in improving the overall prediction performance.
4.2
Data Cleaning
The OSN dataset required data cleaning to discount retweets and successive posts from
the same users within a certain period of time.
-
Retweets
: A retweet in Twitter is a post originally made by one user that is forwarded
by another user. For flu tracking, a retweet does not indicate a new ILI case, and thus


Search WWH ::

Custom Search