Biomedical Engineering Reference
In-Depth Information
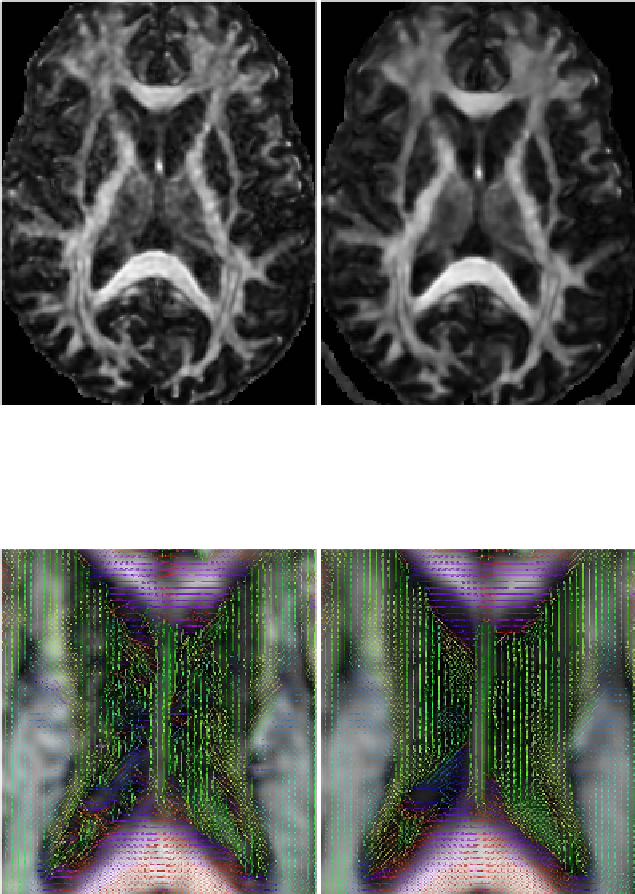
(a) From original DWI data (b) From denoised DWI data with
λ
=
σ/
2
Fig. 7.
A slice of the Fractional Anisotropy estimated from the Tensor Image. Dark colour cor-
responds to values near zero (isotropic regions) and bright color corresponds to values near one
(anisotropic regions).
(a) From original DWI data (b) From denoised DWI data with
λ
=
σ/
2
Fig. 8.
A detail of the first eigenvectors of the DTI over the FA image. The color is based on the
main orientation of the tensorial data. Red means right-left direction, green anterior-posterior and
blue inferior-superior. Fibres with an oblique angle have a color that is a mixture of the principal
colors and dark color is used for the isotropic regions.
needed in order to be able to calculate the DTI, which is a positive defined matrix.
The noise present into the DWI scalar images can generate small, negative eigenval-
ues. Increasing the number of directions along which the brain is scanned improves
the image quality but at the expenses of a longer acquisition time. The importance
of pre-processing the DW Images previously to the DTI reconstruction is then
Search WWH ::

Custom Search