Biomedical Engineering Reference
In-Depth Information
4
x
10
21
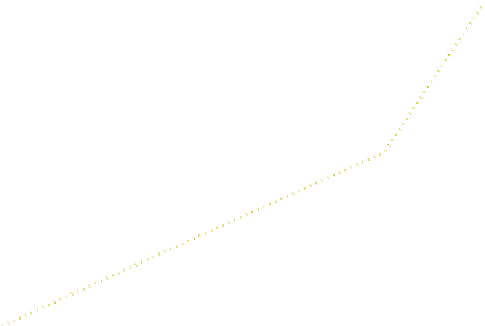
1.56 mm/s
3.12 mm/s
4.68 mm/s
6.25 mm/s
7.78 mm/s
9.35 mm/s
3.5
3
2.5
2
1.5
1
0.5
0
0
0.14
0.25
1.2
Emitting−receiving fibre distance (mm)
Fig. 2.
M1
vs.
emitting-receiving fibre distance, on the phantom model with 25% milk concentra-
tion for 635 nm laser light wavelength
Similar results were obtained for all velocities in what concerns the mean depth of
the Doppler events per photon, the percentage of Doppler shifted photons detected and
the mean of Doppler scattering events per photon, as these parameters are independent
of the velocity of the moving fluid.
The first order moment of the Doppler power spectrum, M1, was also evaluated. Fig-
ure 2 shows the effect on M1 when the fiber distance increases, for each velocity and
for a milk concentration of 25%. It can be seen that higher values of M1 come from
larger fiber separations whereas the lower values of M1 are obtained for 0 mm fiber
separation. Another observation is that, in general, M1 increases with the velocity and
with the milk concentration. This is not surprising since M1 is proportional to perfusion
(Perf), which in turn is proportional to the scatterers concentration times their average
velocity. However, in some specific cases M1 does not increase with the velocity, espe-
cially for the two highest velocities for 1.2 mm fiber distance. This might be due to the
phantom model that saturates in such extreme situations.
Phantom Measurements.
In the measurements made, the perfusion increases with milk
velocity and with the emitting-receiving fibre distance for the aqueous milk solution of
25%. For the other milk concentrations the perfusion saturates for the higher velocities.
No perfusion tendency was obtained for the different scatterers concentration.
Positioning the probe in the top of the microtube phantom was difficult due to the
microtube curvature. This, together with the small milk volume in the microtube, when
compared with the tube volume, lead to the sub-estimation and uncertainties of the per-
fusion measurements. These factors could be the reason for the non-linearity obtained.


Search WWH ::

Custom Search