Biomedical Engineering Reference
In-Depth Information
(a)
(b)
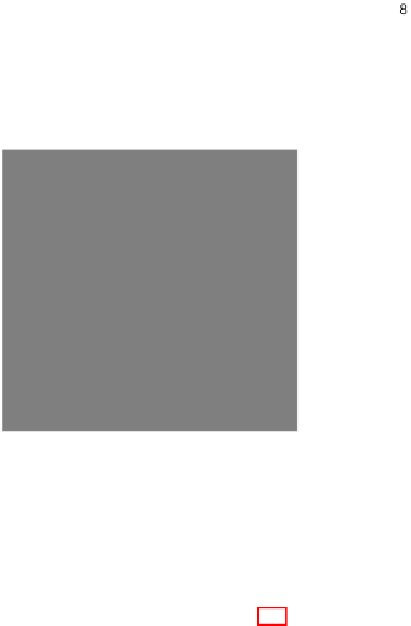
Fig. 5.
Median
−log
10
(p-value) values for the different layers of the FLTM, resulting from asso-
ciation tests between the phenotype and latent nodes - simulations under thirty-six conditions. (a)
Causal SNP ancestor nodes (As). (b) Other latent nodes (Os). The different windows represent
possible genetic scenarii. At the top of each window, the range of the simulated causal SNP's
minor allele frequency and the disease model assumption (additive, dominant, multiplicative or
recessive) are indicated. The three different symbols used refer to the genotype relative risks con-
sidered for the simulated causal SNP (see Legend and 6.1). Layer
0
refers to the association tests
between the phenotype and the causal SNP (over all
100
replications).
obtained with most of the methods dedicated to association studies). As regards the O
nodes, null associations are reported in all configurations.
7.2
Confirmation on Real Data
The ability of FLTM to capture the indirect associations was also evaluated on real data.
The dataset used is the
890
kb
region flanking the
CYP2D6
gene on human chromosome
22q13. This gene has a confirmed role in drug metabolism [25]. The dataset consists
of
32
SNP markers genotyped for
268
individuals and was downloaded from the R
package graphminer developed by Verzilli and collaborators [5]. The SNP
19
at the
position
550
kb
is the closest marker to
CYP2D6
gene (at
525
.
3
kb
). For this reason,
SNP
19
is considered as the causal marker.


Search WWH ::

Custom Search