Biomedical Engineering Reference
In-Depth Information
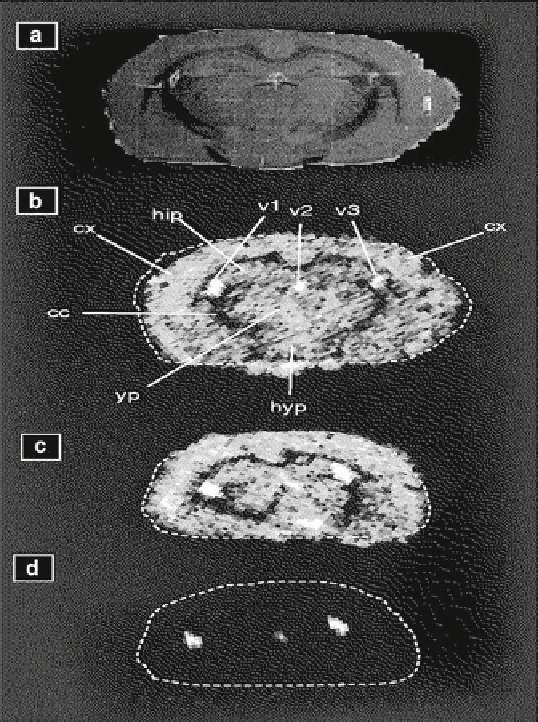
Fig. 2
(
a
) The optical image of a rat brain from a coronal section. (
b
) Matrix-assisted laser desorp-
tion/ionization (MALDI)-mass spectrometry (MS)/MS images of astemizole in the rat brain slice
without perfusion and (
c
) with perfusion; cortex, hippocampus, corpus callosum, hypothalamic
region, thalamus region, choroid plexus, dorsal third ventricle, and lateral ventricle are indicated
by arrows. (
d
) MALDI-MS/MS images of M-14 metabolite of astemizole in the rat brain slice
(Li et al. [
152
] , Reproduced with permission from Future Science Ltd)
on MALDI intensity. This study also addressed issues such as (1) uniform coating by
the matrix, (2) linearity of MALDI signals, and (3) redistribution of surface analytes.
Matrices tested were SA, CHCA, DHB, 3-hydroxypicolinic acid, ferulic acid, and caf-
feic acid. Matrix solutions were prepared at around 25 mg/mL in acetonitrile-water or
methanol-water (80:20). Among these matrices, SA yielded the highest sensitivity.
4.1.2
Spleen-Liver
Signor [
54
] reported qualitative and quantitative analysis of erlotinib and its
metabolites in rat liver and spleen following an oral administration at a dose of