Biomedical Engineering Reference
In-Depth Information
100
S
-Hyo
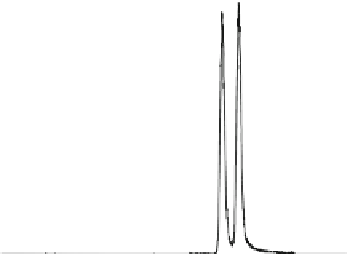
31.1 min
R
-Hyo
33.4 min
retention time
Fig. 3
Chiral separation of atropine (racemic mixture of
S
- and
R
-hyoscyamine). Analysis of
buffered serum dilution was performed according to John et al. [
49
] using two consecutively
coupled AGP columns (150 mm × 2.0 mm I.D., 5 mm) in isocratic mode with solvent A (0.01 M
NH
4
FA, pH 8.0) and solvent B (0.01 M NH
4
FA in 25 % v/v ACN, pH 8.0) in 85:15 ratio at 300 m l/
min and 40 °C. Detection was done by positive ESI MS/MS in MRM mode
3.2.2
Chiral Separation and Enantioselective Determination
RP-separations discussed above do not differentiate between enantiomers of analytes
and thus do not allow chiral analysis. However, stereochemistry of TA agents is a
critical issue with respect to pharmacological properties. As discussed above
(Sect.
2.1
) natural TTA are biosynthesized stereospecifically occurring as
S
-variants
of, e.g. hyoscyamine and scopolamine (Fig.
1
). Atropine is a racemic mixture of both
hyoscyamine antipodes that is administered clinically even though only
S
-hyoscyamine
exhibits pharmacological activity on MR (eutomer) [
33
] . Therefore, analytical dis-
tinction of eutomer and distomer appears recommendable when characterizing PK
behaviour and correlating clinical effects with circulating drug concentrations. Only
three procedures were introduced in the literature to date, that allow quantitative
distinction of both hyoscyamine enantiomers in mammalian specimens by LC-MS
techniques [
47-
49
]. Two of them represent chiral separations using HPLC columns
for selective interaction between the stationary phase and the analytes.
Siluk et al. applied a Chirobiotic V column (250 mm × 4.6 mm I.D., 5 m m, Astec)
for separation of
R
- and
S
-hyoscyamine extracted from human plasma for a PK
study [
48
]. The stationary phase consists of spherical silica gel with the covalently
attached high-purity macrocyclic glycopeptide vancomycin operated in reversed-
phase mode by a gradient mobile phase of methanol, acetic acid, and triethylamine.
Coupling to an APCI interface and a single quadrupole mass analyser established a
broad linear range of two orders of magnitude (0.5-50 ng/ml) and a sufficient LOQ
of 0.5 ng/ml (Table
5
). This chiral method revealed that
S
-hyoscyamine concentra-
tions were slightly lower than of
R
-hyoscyamine after i.v. bolus injection of atropine
sulphate and subsequent infusion in man [
48
] .
The second chiral method was presented by John et al. [
49
] . Distinction of
hyoscyamine variants from rabbit serum dilutions was enabled on two consecutive
AGP columns (each 150 mm × 2 mm I.D., 5 mm, ChromTech) coupled to +ESI-MS/