Biomedical Engineering Reference
In-Depth Information
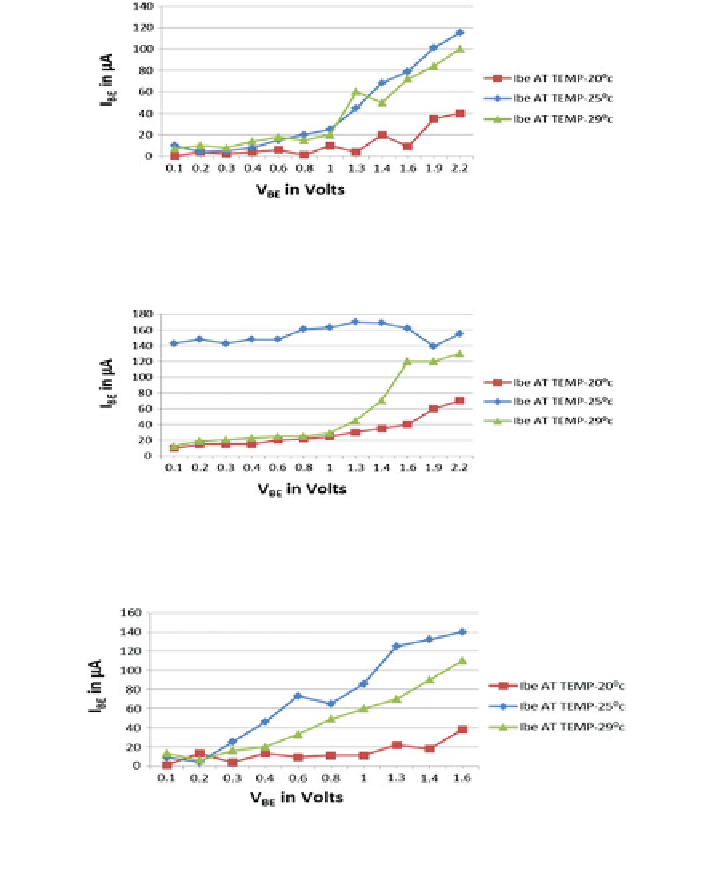
Graph 1 Input characteristics: human blood transistor (flow mode) spacing between probes
D = 1.1.1.1, 40 drops/min, and V
CE
= 1.5 V
Graph 2 Output characteristics: human blood transistor spacing between probes D = 1.1.1.1,
40 drops/min, V
BE
= 1.5 V
Graph 3
I/P characteristics of transistor spacing between probes D = 1.1.1.1, 40 drops/min,
and
V
CE
= 3V
The Measured Experimental Data with Remarks
The measured data is plotted in the graphs and graphs
1
,
2
,
3
,
4
,
5
,
6
,
7
, and
8
depicts input and output characteristics of the transistor.
From the first order of approximation study of Graphs
1
,
2
,
3
,
4
,
5
,
6
,
7,
and
8
the following inferences can be drawn:
Search WWH ::

Custom Search