Biomedical Engineering Reference
In-Depth Information
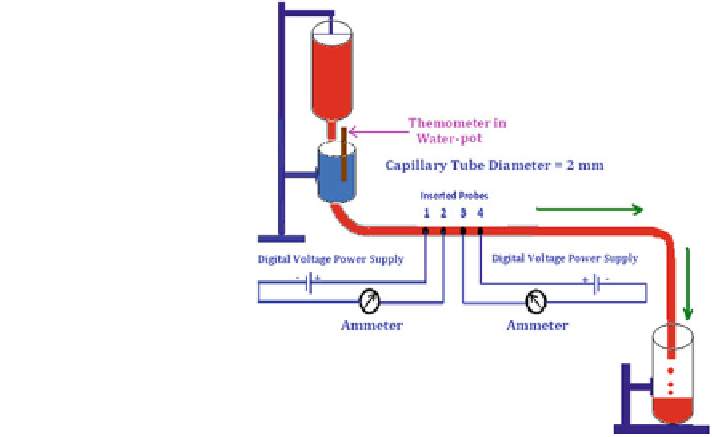
Fig. 1 Experimental setup
for blood transistor
development
this measurement, we kept fixed distance between inserted probes 1-2-3-4,
flow rate constant, and also temperature of water pot. Observations were
recorded. Graph
1
depicts a typical input characteristic of the transistor.
2. For Output Characteristics: Keeping fixed distance between probes 1-2-3-4,
flow rate constant, and constant water pot temperature., varying voltage V
CE
between probes 3 and 4 was applied while keeping voltage V
BE
between probes 1
and 2 constant, observations were recorded. Graph
2
depicts typical output
characteristics of the transistor.
3. Effect of varying physical blood parameters: Process of measurements under
1 and 2 was repeated to study the effect of variable parameters (1) temperature,
(2) distance between probes 1-2-3-4, (3) flow rate (drops/min) of the blood
transistor was considered while conducting development of this transistor
configuration.
4. On Data repeatability and error possibilities: The readings for V
BE
, V
CE
, I
BE
,
and I
CE
(after they stabilized) were repeatedly observed and recorded. Under
any uncertainties, the readings (magnitude wise) were found to be repeatable
within 5-10 %. The readings (depicting magnitudes) sometimes were vibrating
but we took precaution and recorded their average. From an error analysis point
of view, the accuracy was assured to remain within 10 % (measurement
accuracy). By changing the height of the tank the blood flow rate variation was
achieved.
5. Keeping brevity of manuscript in view, only representative typical graphs are
presented to demonstrate the feasible functioning of the device developed.
Search WWH ::

Custom Search