Biomedical Engineering Reference
In-Depth Information
0.05
0
-0.05
0
200
400
600
800
1000
1200
1400
1600
1800
2000
0.05
0
-0.05
0
200
400
600
800
1000
1200
1400
1600
1800
2000
0.05
0
-0.05
0
200
400
600
800
1000
1200
1400
1600
1800
20
0
0
0.1
0
-0.1
0
200
400
600
800
1000
1200
1400
1600
1800
2000
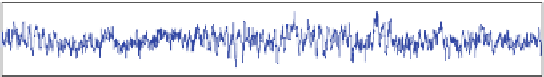
Fig. 4
EEG signal mixed with noise
0.5
0
-0.5
0
200
400
600
800
1000
1200
1400
1600
1800
20
0
0
0.5
0
-0.5
0
200
400
600
800
1000
1200
1400
1600
1800
20
0
0
1
0
-1
0
200
400
600
800
1000
1200
1400
1600
1800
20
0
0
1
0
-1
0
200
400
600
800
1000
1200
1400
1600
1800
2000
Fig. 5
EEG signal after applying independent component analysis
Here, from Fig.
6
we can conclude that artifacts and noise is removed from the
original EEG signal to a great extent because of use of both methods ICA and
wavelet denoising, which use Otsu's method for thresholding.


Search WWH ::

Custom Search