Biomedical Engineering Reference
In-Depth Information
110
100
90
80
70
60
50
40
30
20
10
0
MICROGA PAES
MOGA
NPGA2
SPEA2
NSGA2
JG
Algorithm
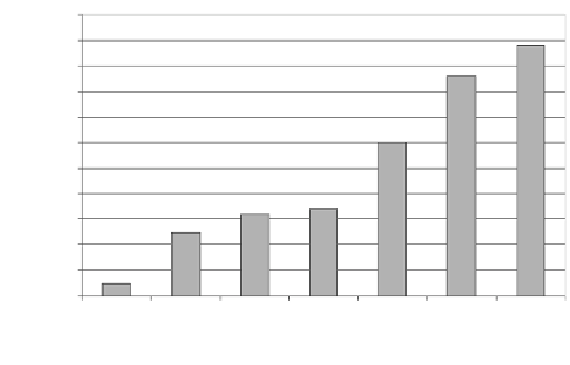
Figure 8.5
Total. number. of. extreme. nondominated. solutions. for. scenario. b:. 80. dB.. (From. Tang,. K.. S.,.
Kwong,.S.,.Man,.K..F.,.A.jumping.genes.paradigm:.Theory,.veriication.and.applications,
IEEE
CircuitsandSystemsMagazine
,.8(4),.18-36,.2008.)
8.7.4 Statistical Test using the binary
ε
-indicator
of. the. number. of. occurrences. of. three. comparison. cases. (same. as. those.
given.in.Section 7.8.4).for.the.two.scenarios.
In.conclusion,.the.JG.was.more.favorable.than.other.MOEAs.for.both.sce-
narios..It.obtained.better.sets.of.nondominated.solutions.with.better.conver-
gence. and. diversity. performance.. Sample. sets. of. nondominated. solutions.
searched.by.different.MOEAs.for.scenarios.a.and.b.are.shown.in
.
Figure 8.6
.
to
.
Figure 8.9
.
for.reference.
Table 8.6
Statistical.Results.of.Binary.ε-Indicator.in.Terms.of.the.Number.of.Occurrences.
in.Three.Different.Cases.for.Scenarios.a.(90.dB).and.b.(80dB)
Scenarios
Case
MOGA
NPGA2
NSGA2
SPEA2
PAES
MICROGA
a:.90.dB
Case.I
1,706
1,912
1,018
1,402
2,138
2,482
Case.II
137
82
642
366
16
0
Case.III
657
506
840
732
346
18
b:.80.dB
Case.I
1,435
1,513
956
1,217
1,769
2,477
Case.II
143
131
860
297
0
14
Case.III
922
856
684
986
731
9
Source:
Data.from.Chan,.T..M.,.Man,.K..F.,.Tang,.K..S.,.Kwong,.S.,.A.jumping-genes.para-
digm. for. optimizing. factory. WLAN. network,
IEEE Transactions on Industrial
Informatics
,.3(1),.33-43,.2007.


Search WWH ::

Custom Search